3. The Netsight3 home page
N.B. This page is publicly visible without having to log in.
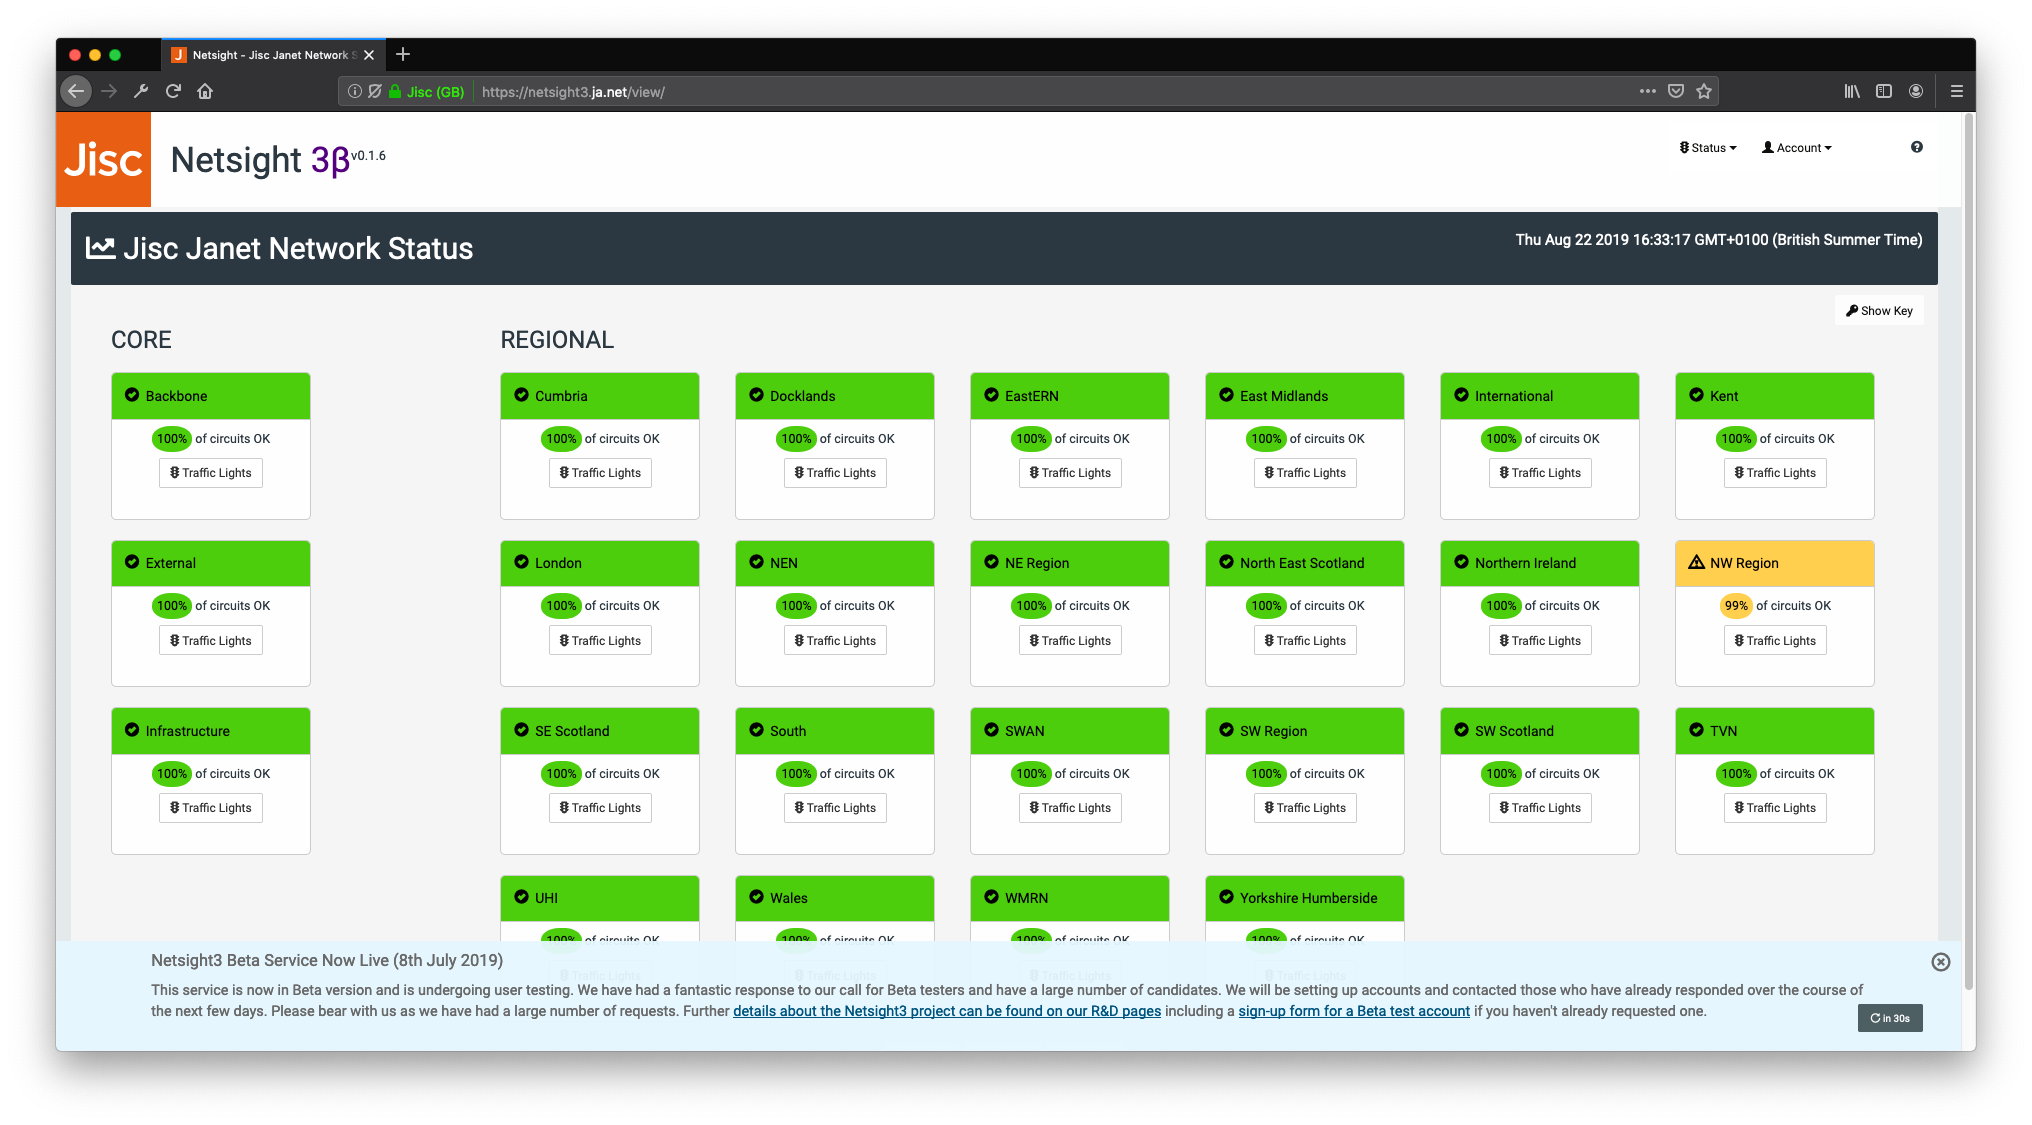
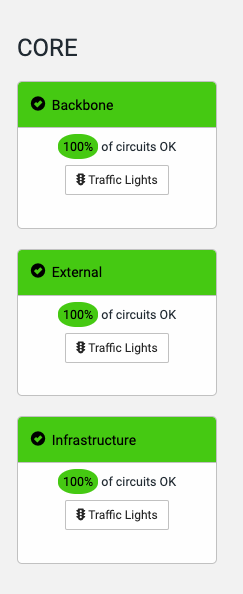
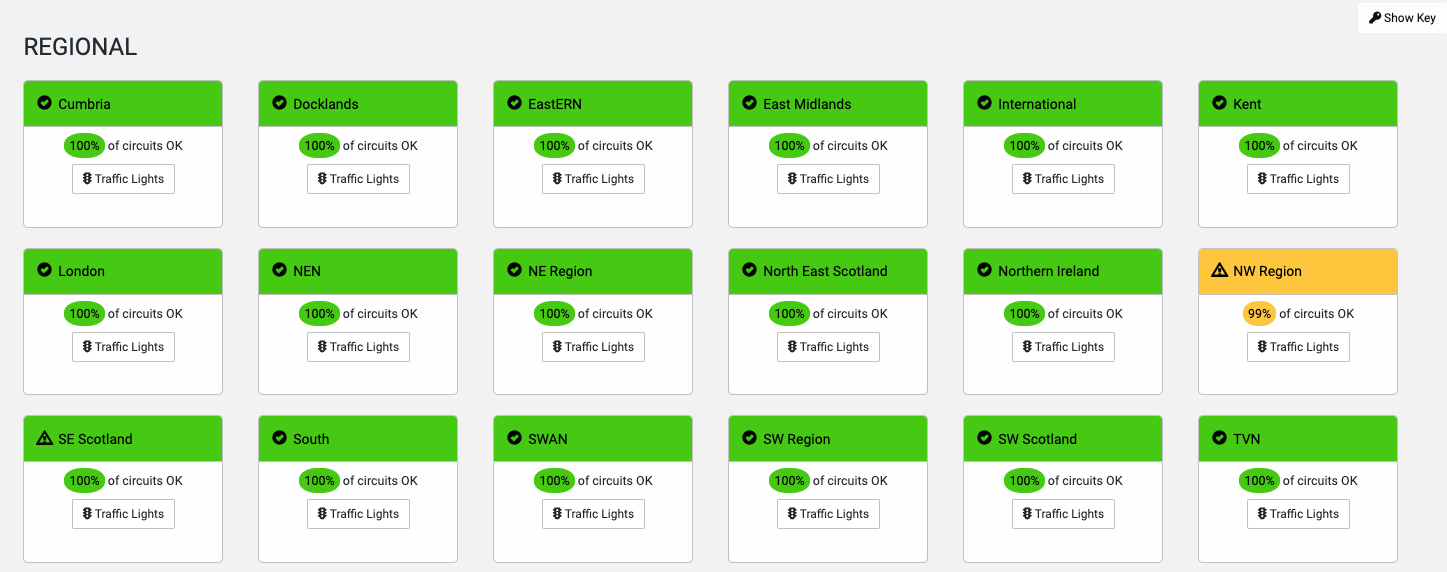
3.1 Janet Network status
The Netsight3 home page provides a summary view of circuit statuses for the different regions of the Janet Network. The display is based on a RAG rating (Red, Amber, Green) for the number of circuits in each region that are down, degrade and up respectively.
The home page is also the entry point for the Traffic Lights sub-system which uses RAG rating to display whether circuits (represented by Reporting Paths) are either down, degraded or up (red, amber or green respectively).
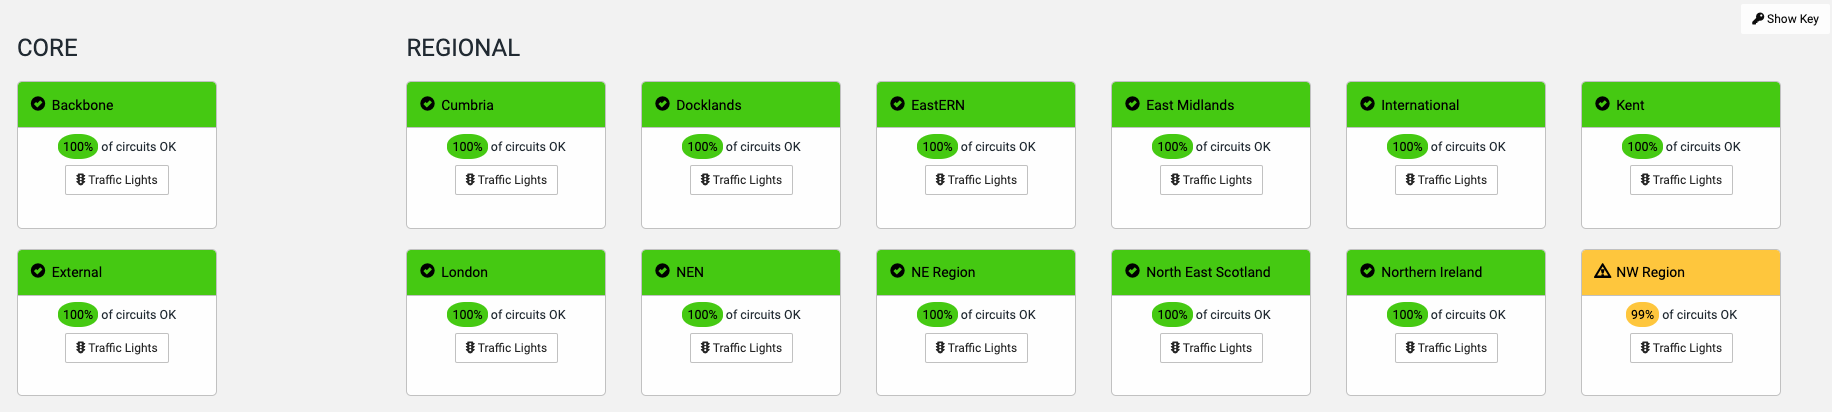
Where a region's card is marked as green, all connections in that area are up. Where a card is marked as yellow, some connections in that region are either degraded or down. Where a card is marked as orange, more than 10% of circuits in the region are down. Where a card is marked as red, that indicates more than 99% of the connections in that region are degraded or down.
The status of each connection is based on ping (ICMP Echo) percentage packet loss. A percentage packet loss greater than 40% and less than 90% would mark a circuit as degraded / yellow. A percentage packet loss of 90% or greater would mean the circuit as down. Packet loss below 40% and the circuit would be marked as up.
3.1.1 Status of the Janet Core
The home page display is split into two sections. One the left hand side there are RAG rated cards, colour coded to display the status of the sections of the Janet Core (Backbone, External connections and Infrastructure).
3.1.2 Status of the Janet Regional Delivery Areas
On the right hand side and filling most of the screen are RAG rated cards colour coded to display the status of the different Regional Delivery Areas of the Janet network.
3.2 Refresh cycles for this page
The home page has two refresh cycles at play (three if you include the one minute refresh cycles of the underlying polling system).
The behaviour of this page differs slightly to the Traffic Lights pages. For those pages, the data is refreshed when the page is loaded into the browser and the refresh cycle is based upon the time the page was first loaded for you.
3.2.1 Marshalling and aggregation of underlying data
The underlying data for both the home and Quick Status pages requires a degree of pre-processing and aggregation and is therefore performed by a process running in the background on a once per minute cycle. A timestamp for when the underlying data was last refreshed is displayed at the top of the page.

3.3 General service announcements
At the bottom of the screen in a blue pop-up layer, the system displays general service announcements and notices.
This is where information about services outages and upcoming maintenance will be displayed.
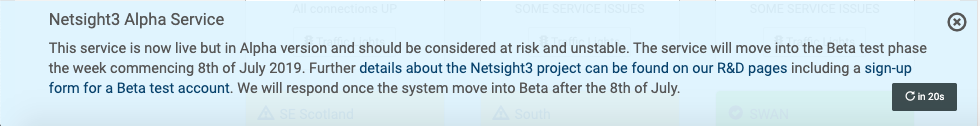
Choosing the dismiss icon, top right in the blue box, will set a cookie and remove the box from view for up to 24 hours, or until your session expires, whichever is sooner. Note that your login session is automatically expired after 24 hours.