Netsight3 End User Guide (Janet Network Community)
Table of Contents
Netsight3 End User Guide (Janet Network Community)
1. Introduction
1.1 About Netsight & Netsight3
Netsight provides insight into the overall status of the Janet Network and valuable information about the utilisation and performance of your connections. Available to all Janet Network-connected organisations, Netsight has been providing network visibility and performance insights for more than 20 years. Netsight3 is the latest iteration of that service.
1.1.1 Who this guide is aimed at
This guide is aimed at people in Janet Network-connected organisations. As a Jisc customer, you will have access to Netsight3, enabling you to view your organisation's current network performance data, as well as current and historical traffic information.
1.2 Using this guide
This guide is written from the perspective of an end user logged in under an account with a Janet Community role.
1.2.1 Accessing Netsight3
You can access Netsight3 using the following URL:
1.3 Further help and support
If you require further assistance, please contact the Service Desk.
2. Using the main menu and login functions
The main (or landmark) navigation elements appear top-right on every screen in the Netsight3 system.
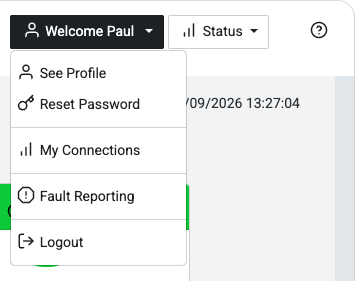
Janet Community users will see two drop-down menus: Welcome and Status.
Other user groups may see different options. The navigation menu described below is for Jisc customers within the Janet Community.
2.1 Using the Account / Welcome navigation menu
2.1.1 Account login
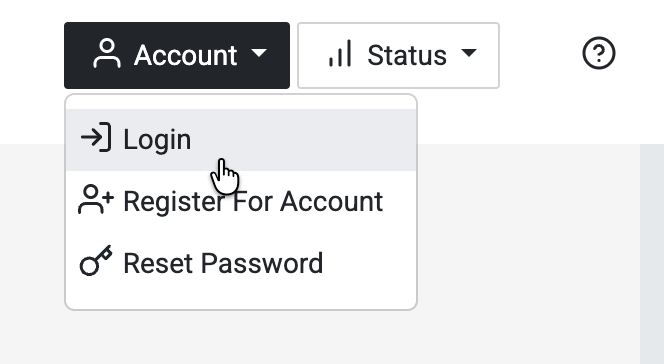
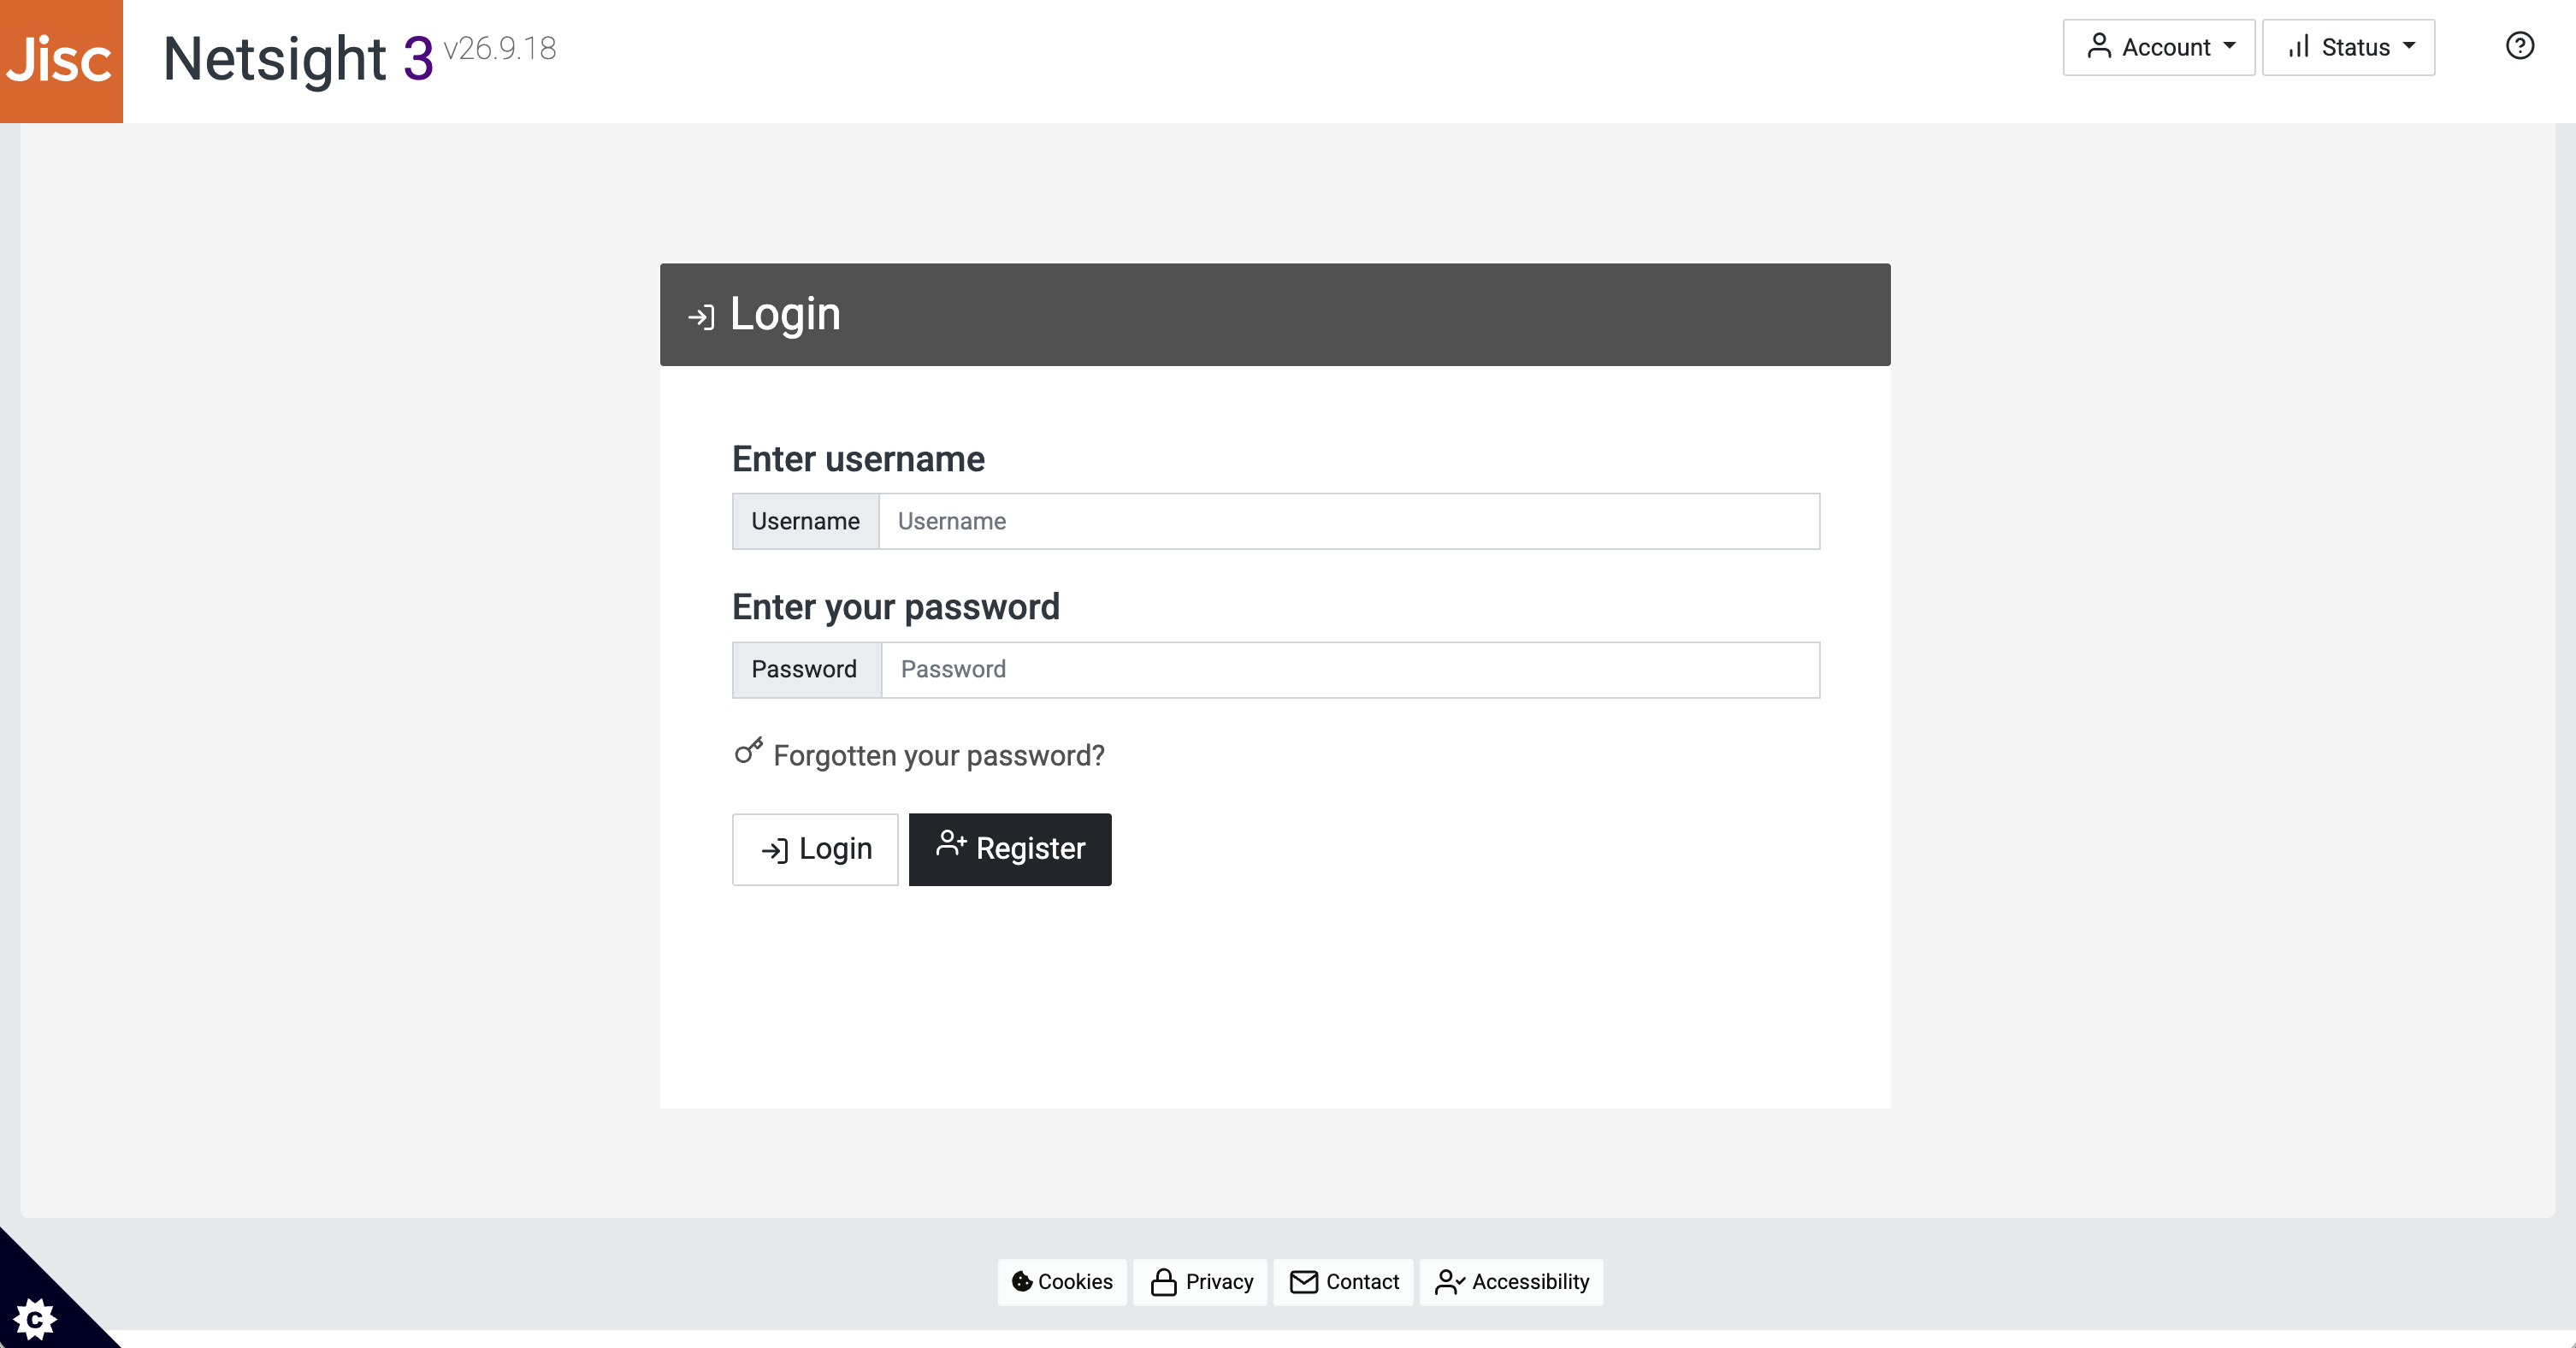
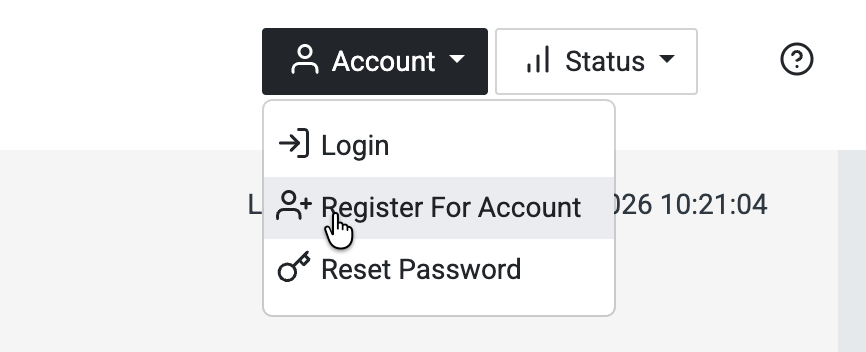
Before you log in, the first menu in the navigation bar is the Account menu. Select this menu and choose Login. Selecting this option takes you to the Login form, where you can enter your username and password.
Once you have logged in, the menu switches to the Welcome view.
2.1.2 Registering for an account
If you don't have an account already or you need to register an account for a colleague, you can do so using the Register For Account option on the Account menu (which appears before you log in).
For further details on registering for an account see Section 3 below.
2.1.3 Resetting your password
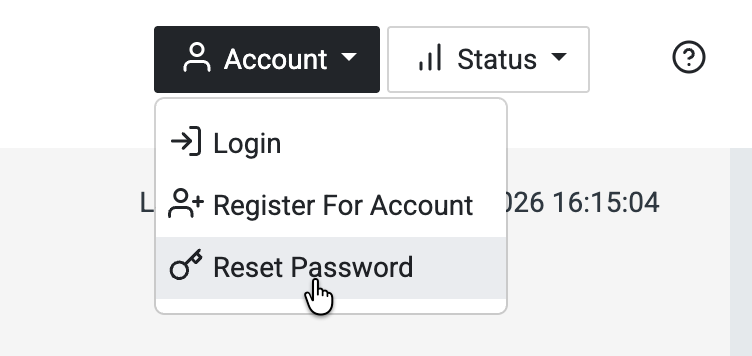
For further details on resetting your password see Section 4 below.
2.1.4 The Welcome menu
The Welcome menu appears in place of the Account menu once you log in. It provides access to several functions including the My Connections screen where you can view circuit information and graphs for your organisation.
For further details about the My Connections view see Section 5 below.
2.2 Using the Status navigation menu
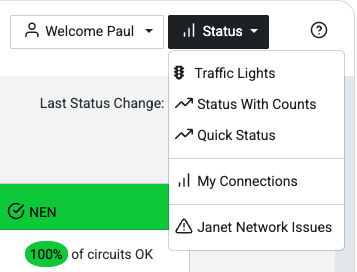
The Status menu provides access to the various network status screens including the Traffic Lights / home screen, the Status With Counts view and the Quick Status view.
Note that you must be logged in to see the latter.
For further details about the network status views, see Section 6 below.
3. Registering for an account
You can register for a new account either for yourself or for a colleague using either the Register For Account option on the Account menu (prior to logging in) or from the Register button on the Login screen.
Please note the following terms and conditions regarding account eligibility:
To register for Netsight3 you must:
- Use an individual work email address.
- Belong to a Janet Network-connected organisation.
- Be authorised to access network information for your organisation.
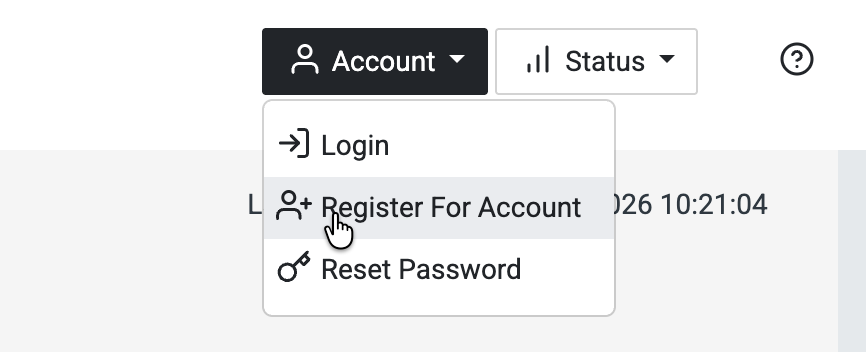
Choose the Register For Account option to be taken to the registration form:
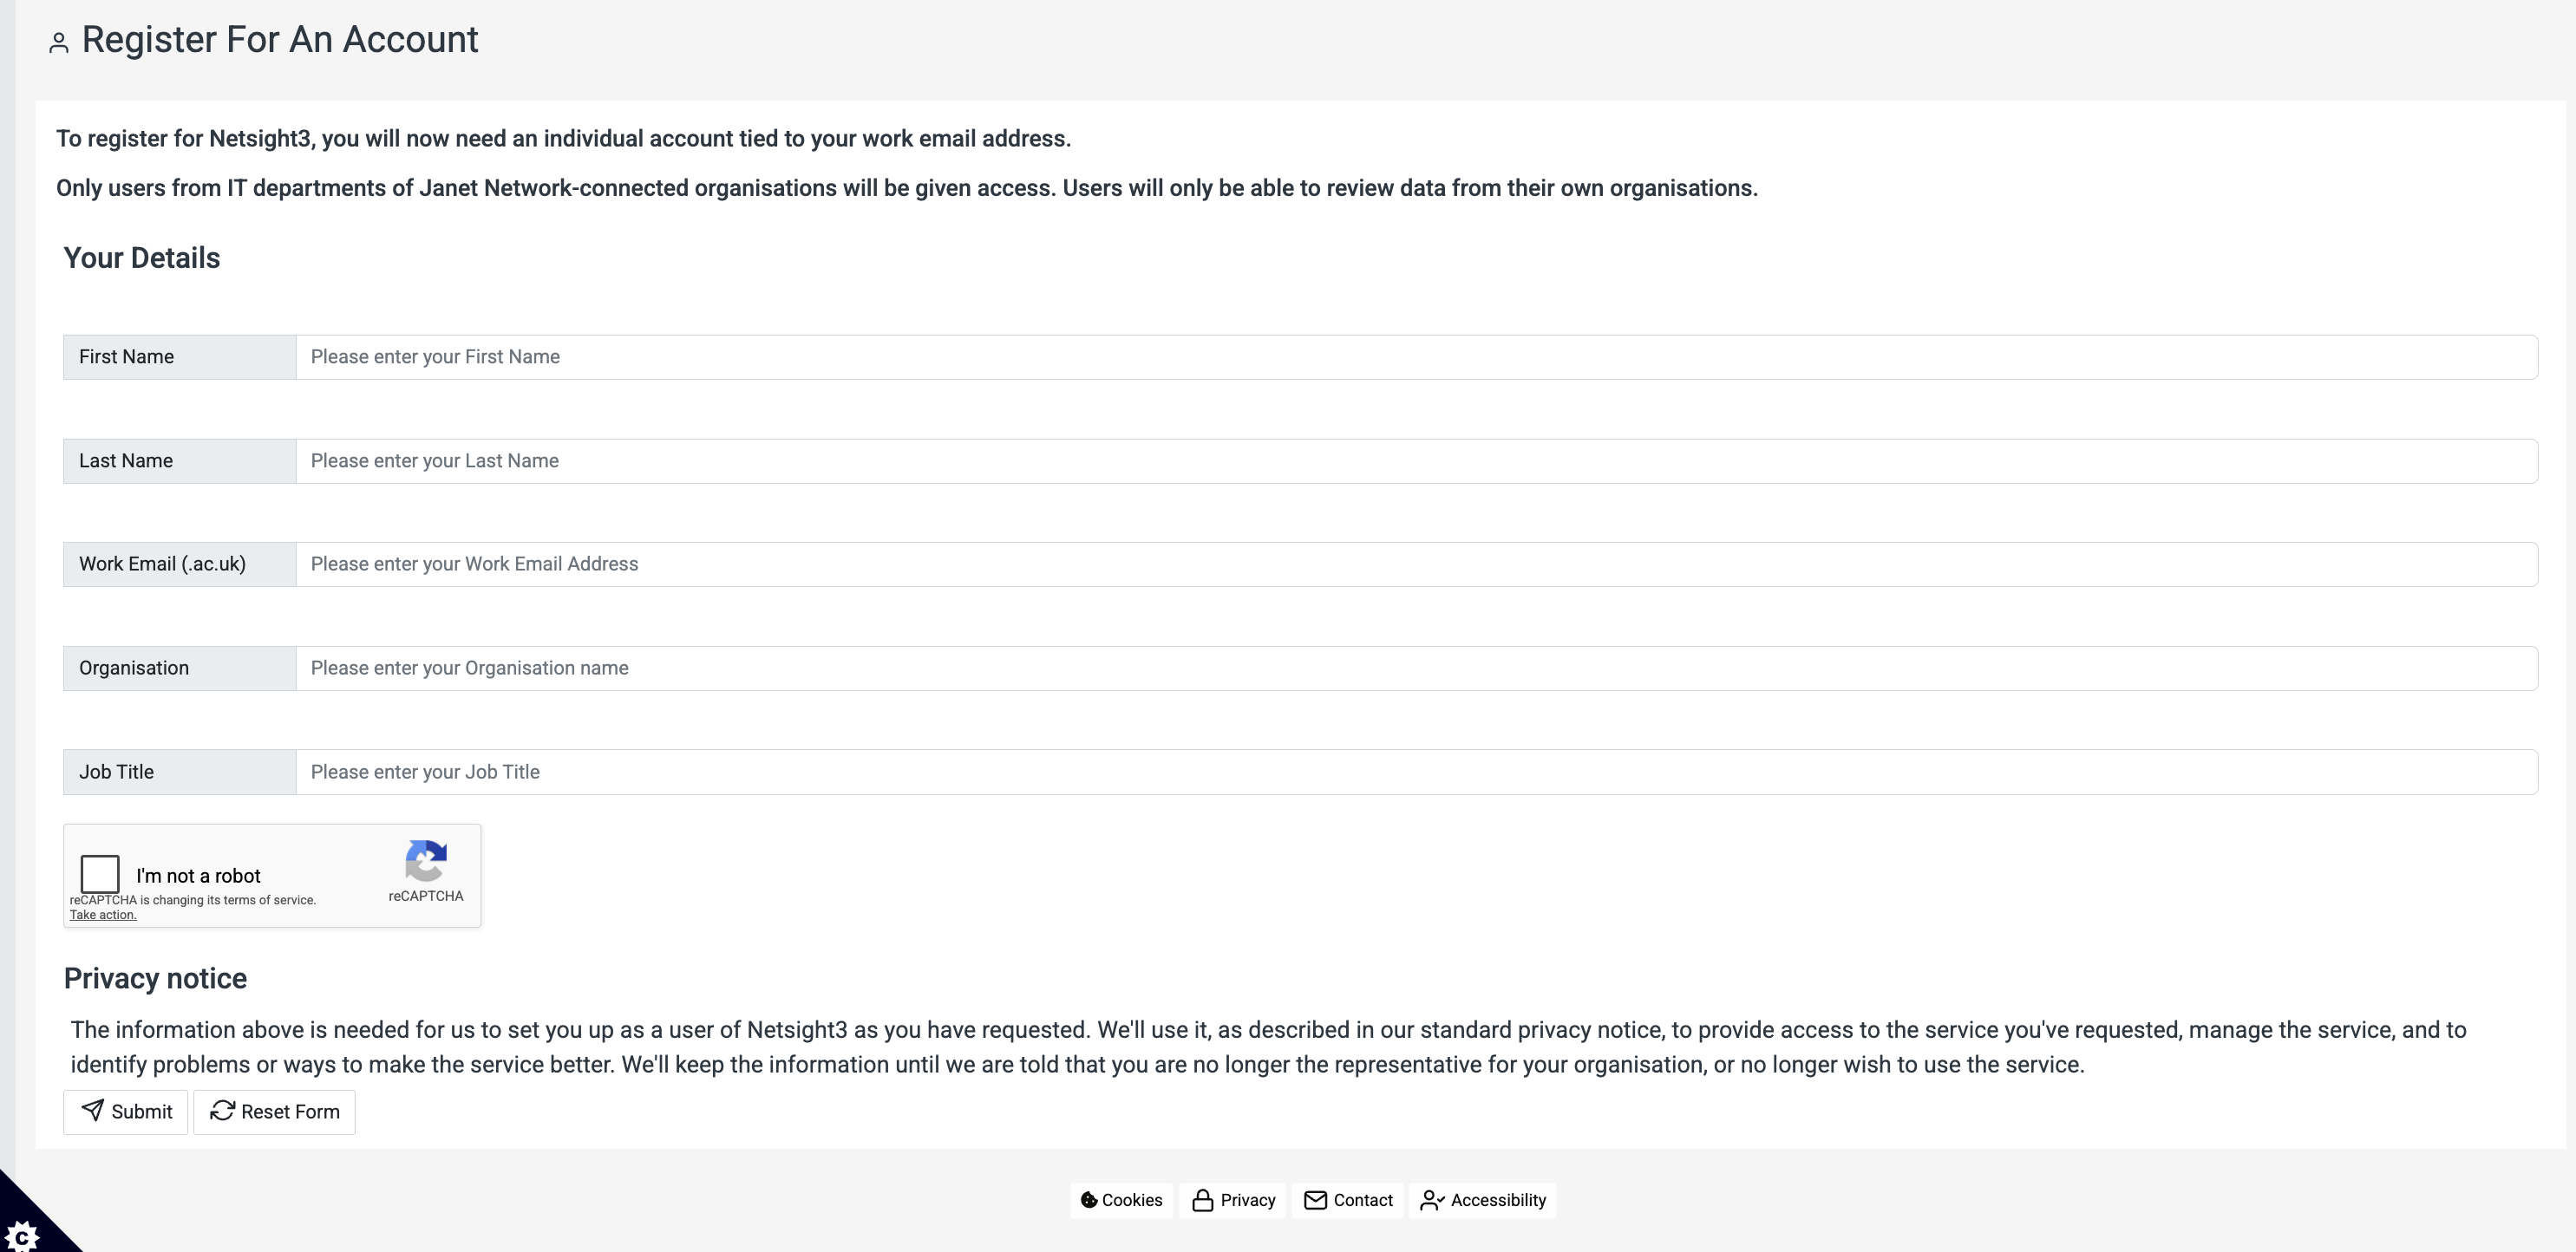
In the form, enter your first and last names in the boxes provided, and then carefully type in your work email address. This will normally be an email address ending in .ac.uk. Personal accounts such as gmail.com or outlook.com addresses will be rejected for security reasons.
Note that as you move through the form, your input will be validated automatically, including attempting to automatically fill in your organisation name based on your email address. If the organisation name cannot be determined automatically, please enter it manually.
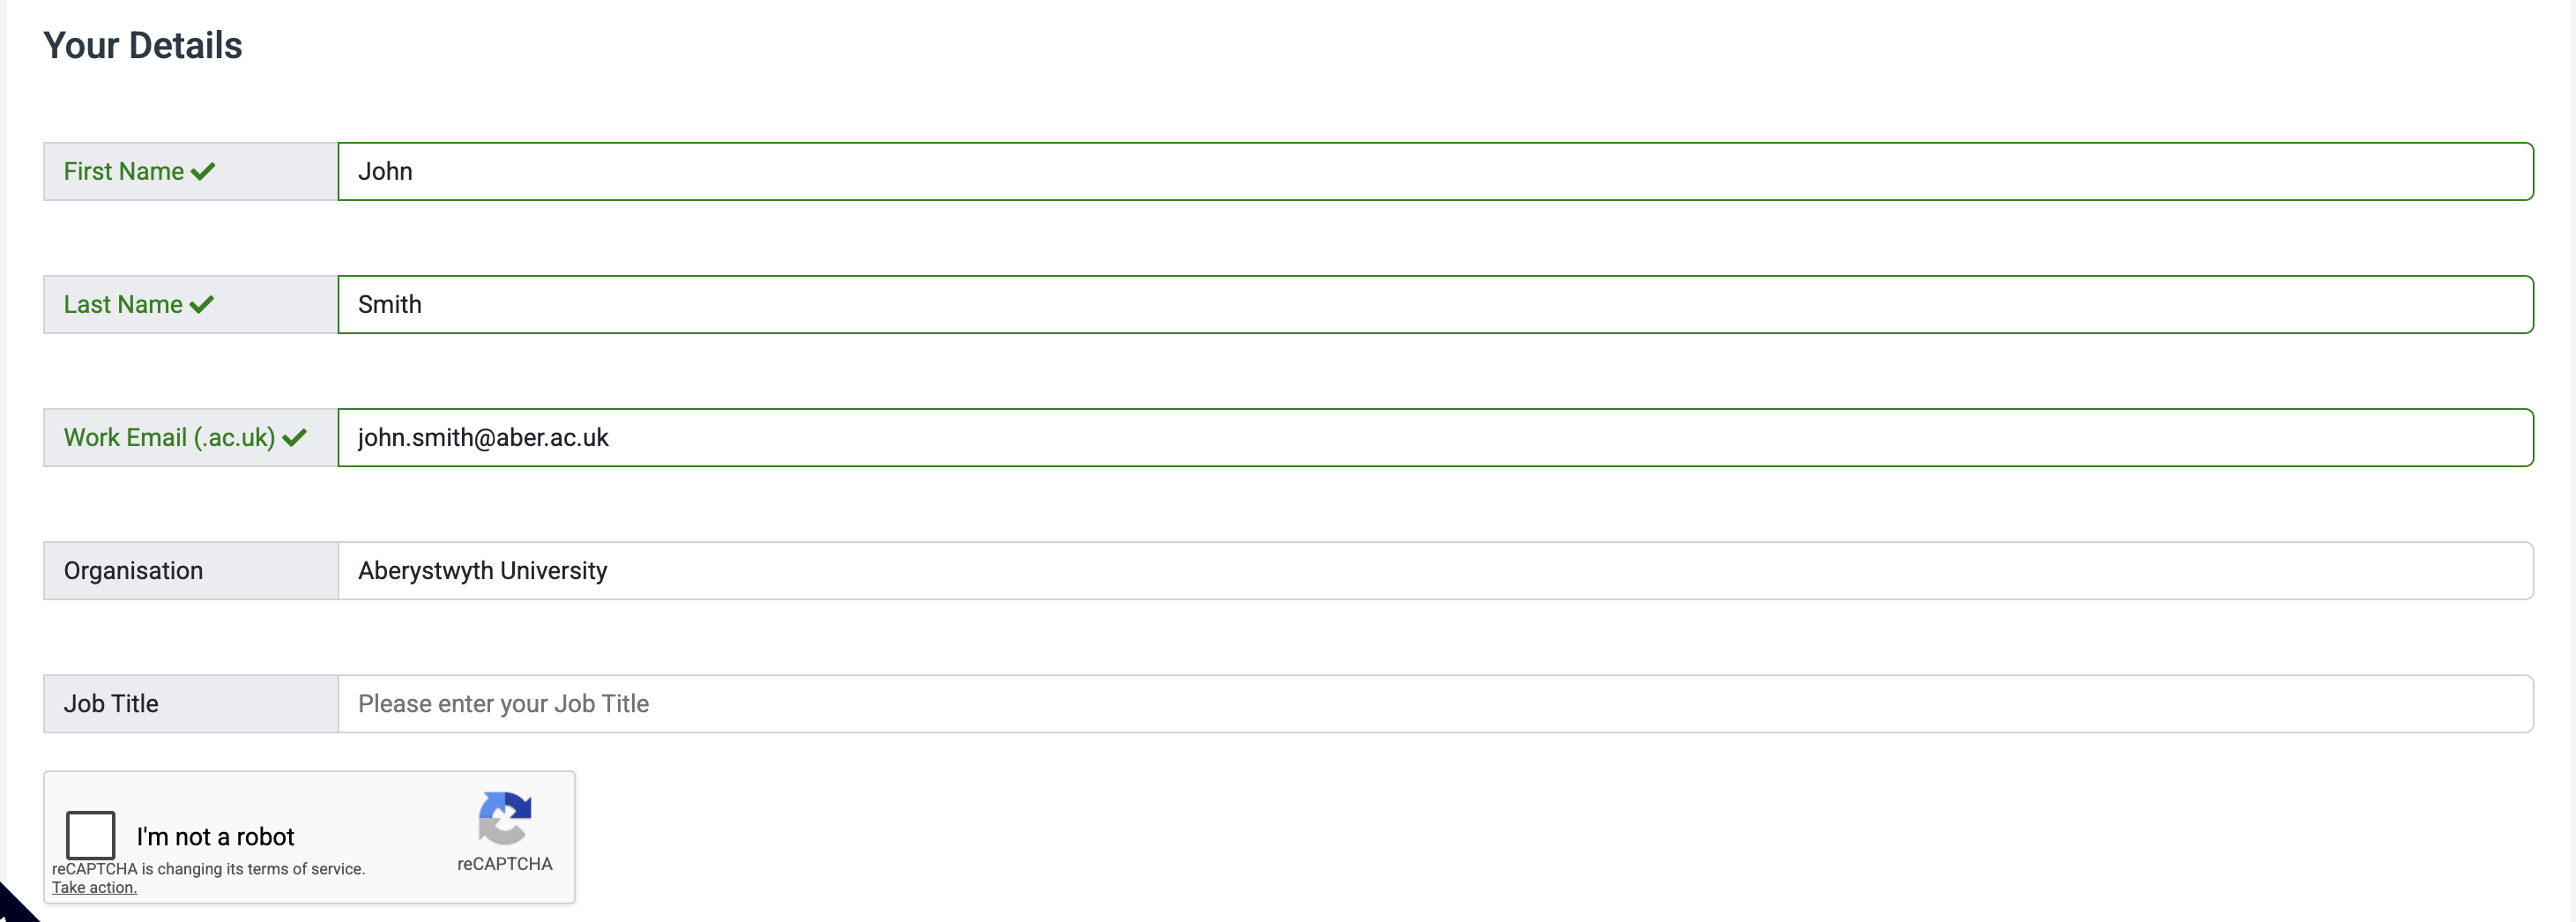
Note that all boxes need to be completed and that you also need to check the I'm not a robot checkbox. This reCAPTCHA verification helps protect the service from automated misuse.
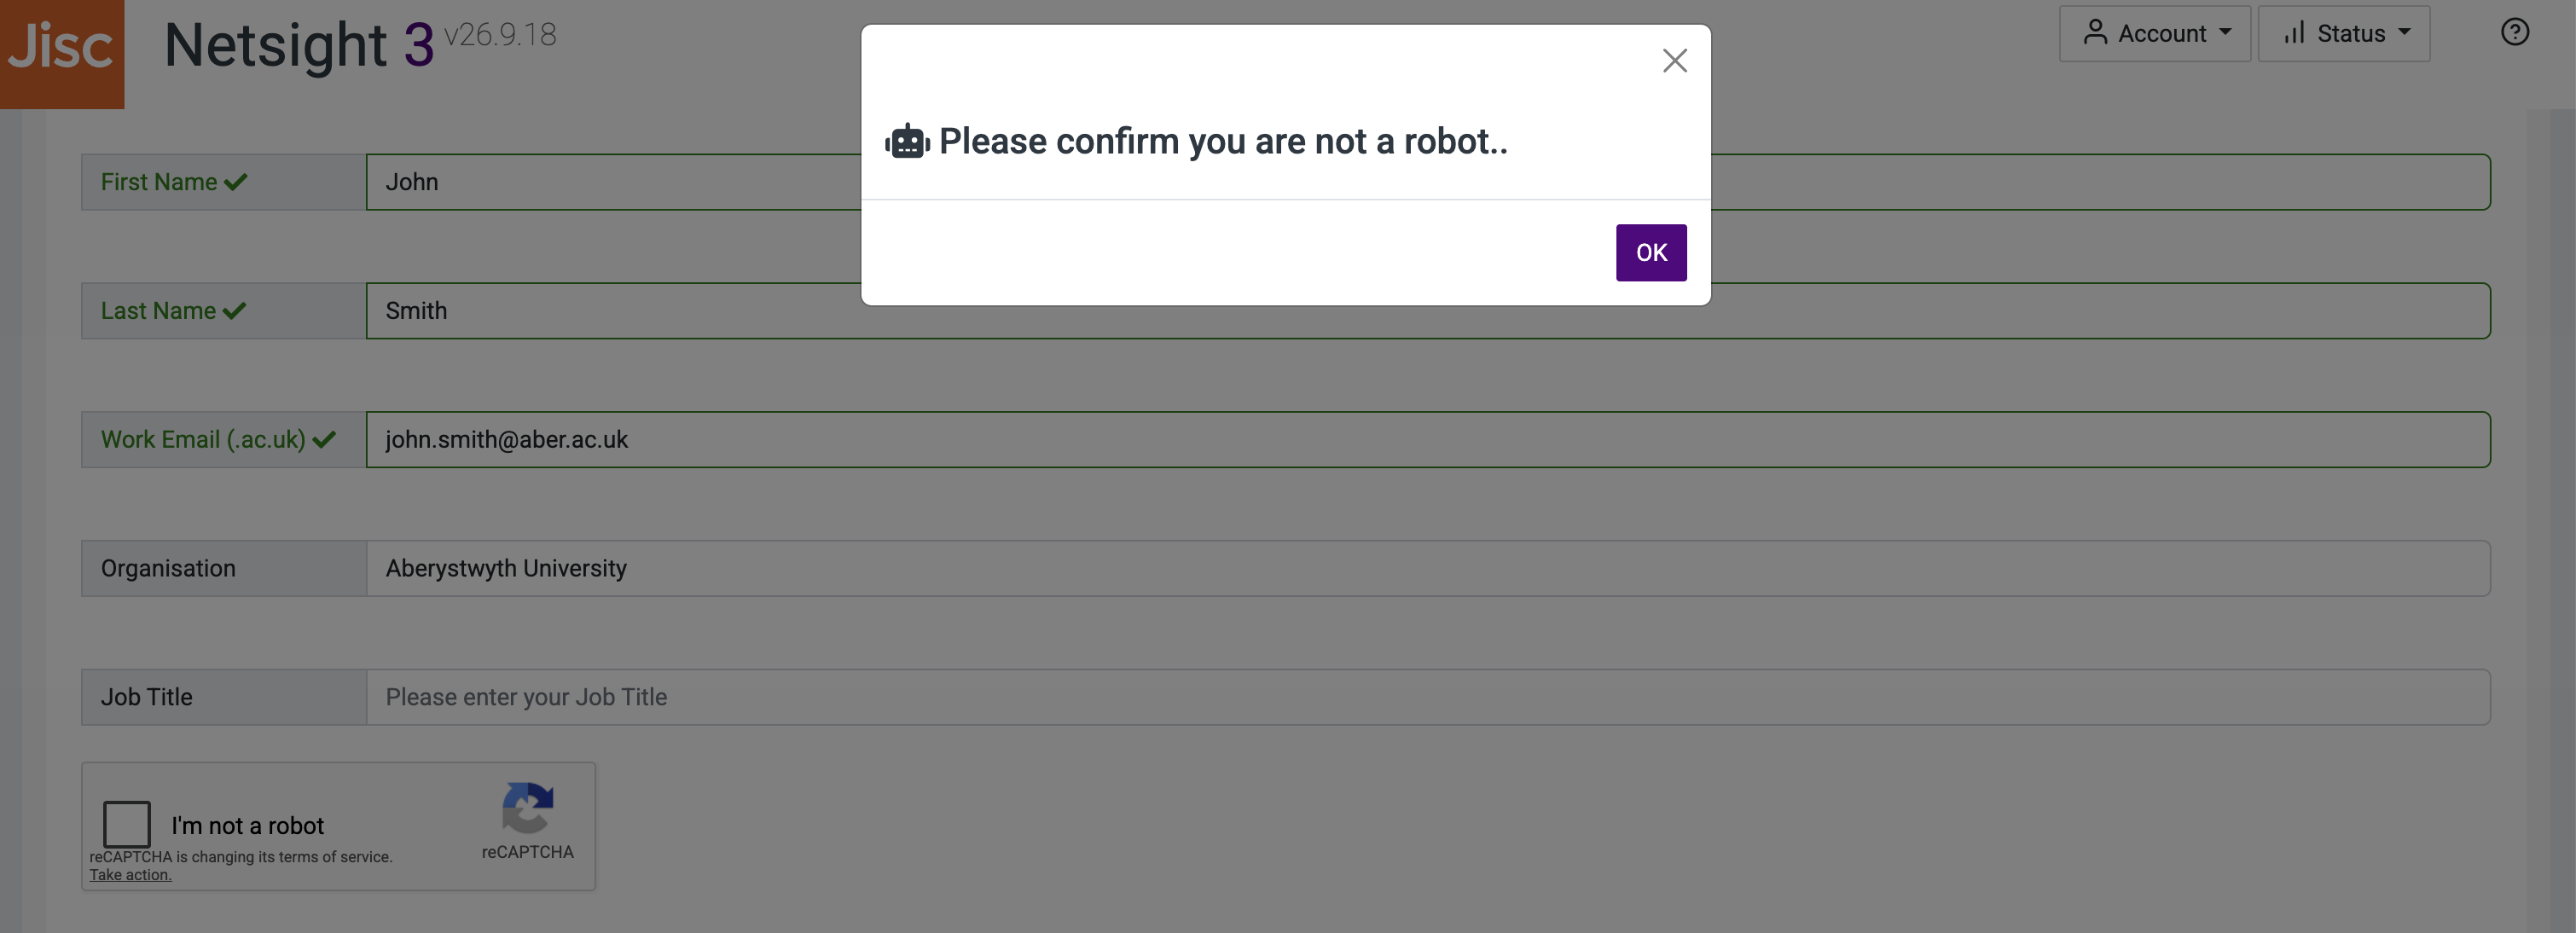
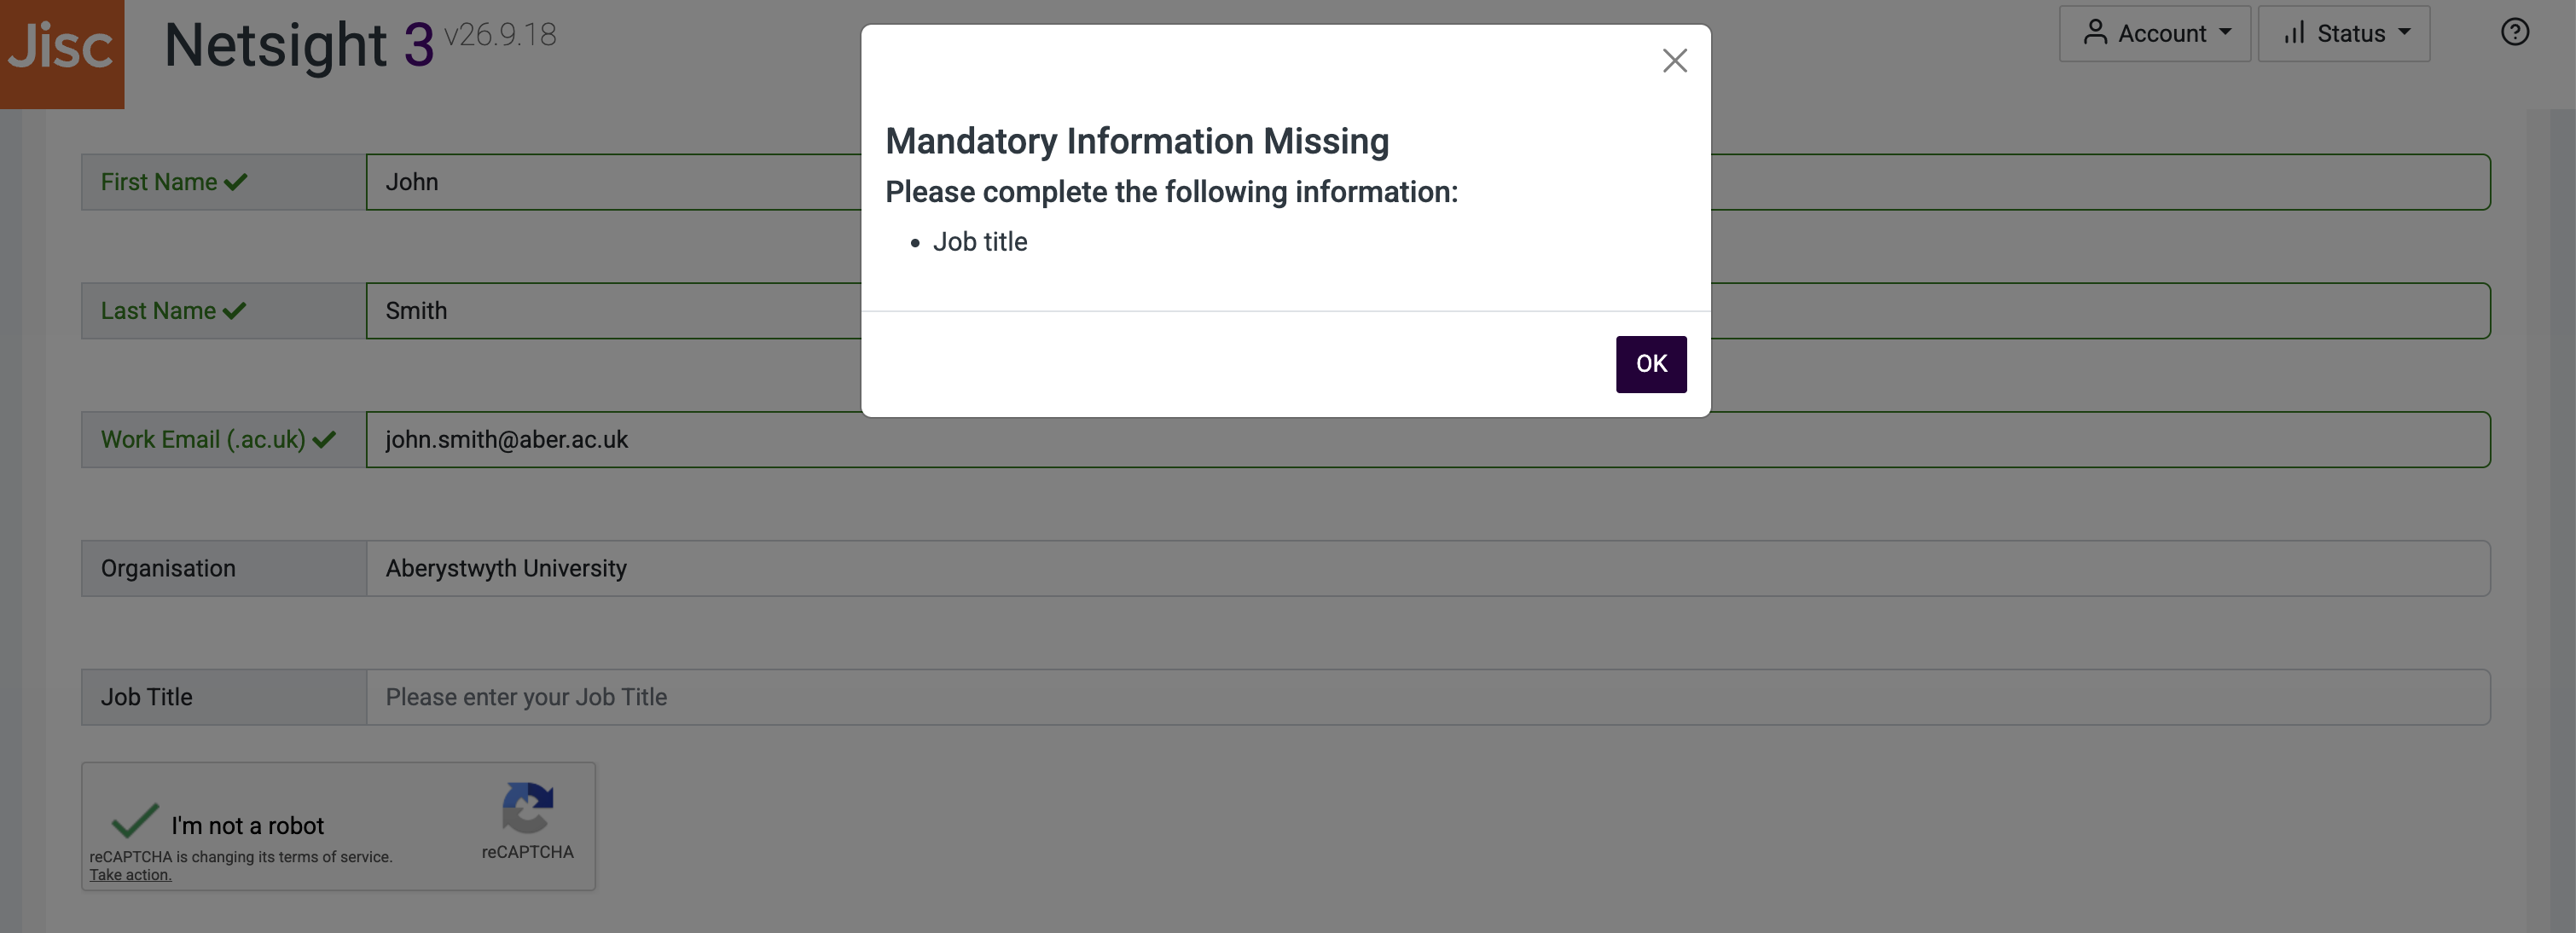
On submission you will see warnings if any information is missing.
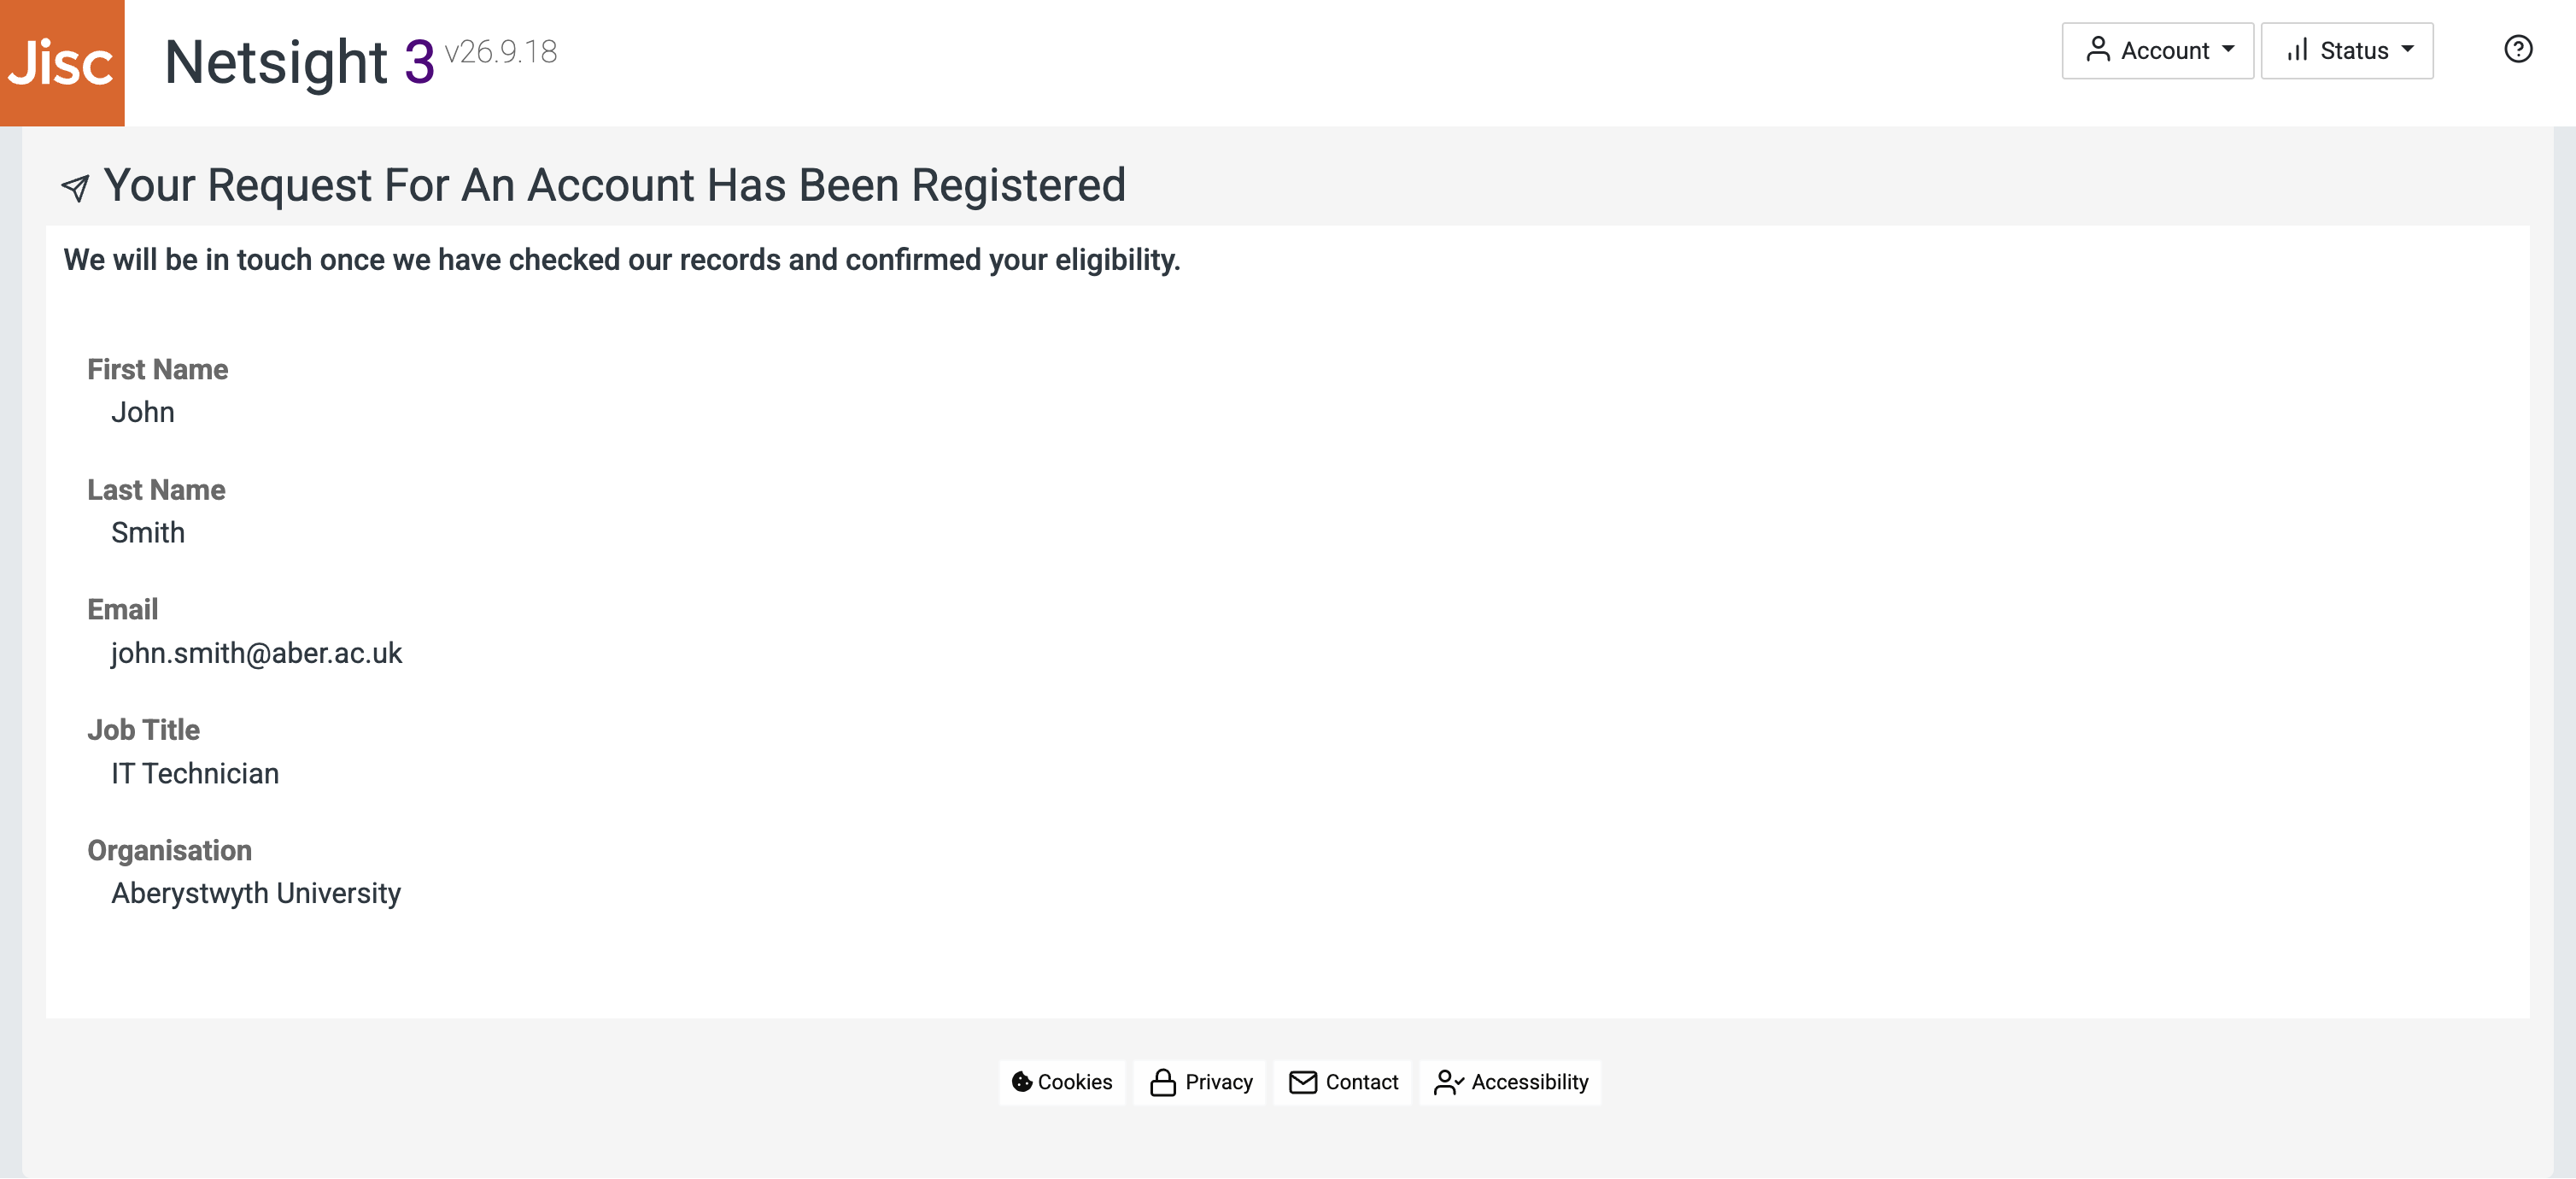
After successfully submitting the form, you will see a confirmation screen and your details will be forwarded to the Netsight3 team for review and approval. This is a manual review process and may take some time to complete.
Once your application has been reviewed and approved, you will receive a confirmation email containing a link to set your password.
4. Resetting your password
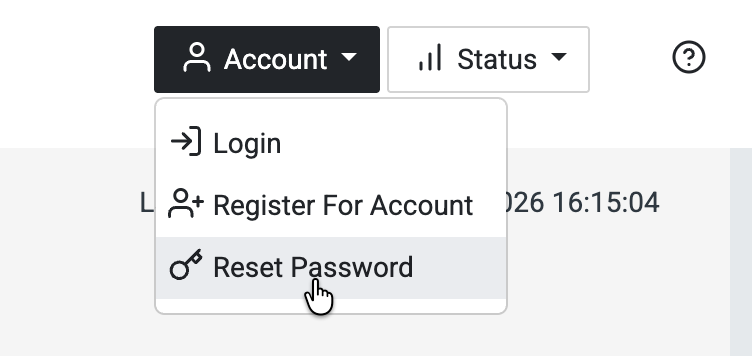
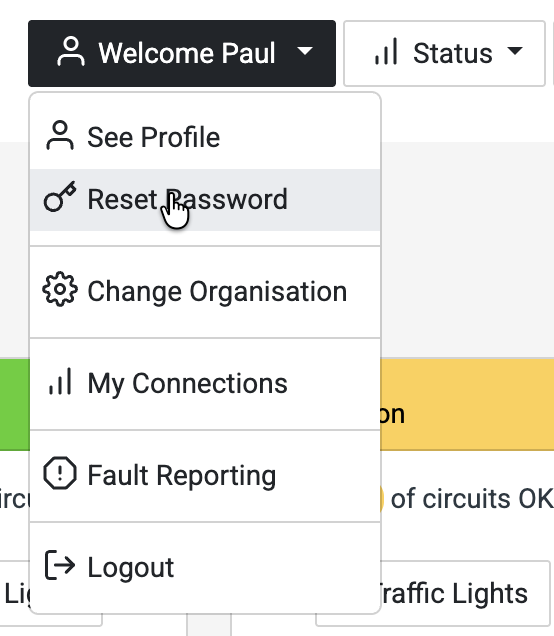
In order to reset your password, choose either the Reset Password option on the Account or Welcome menus.
Alternatively, select the Forgotten Your Password? link in the Login screen.
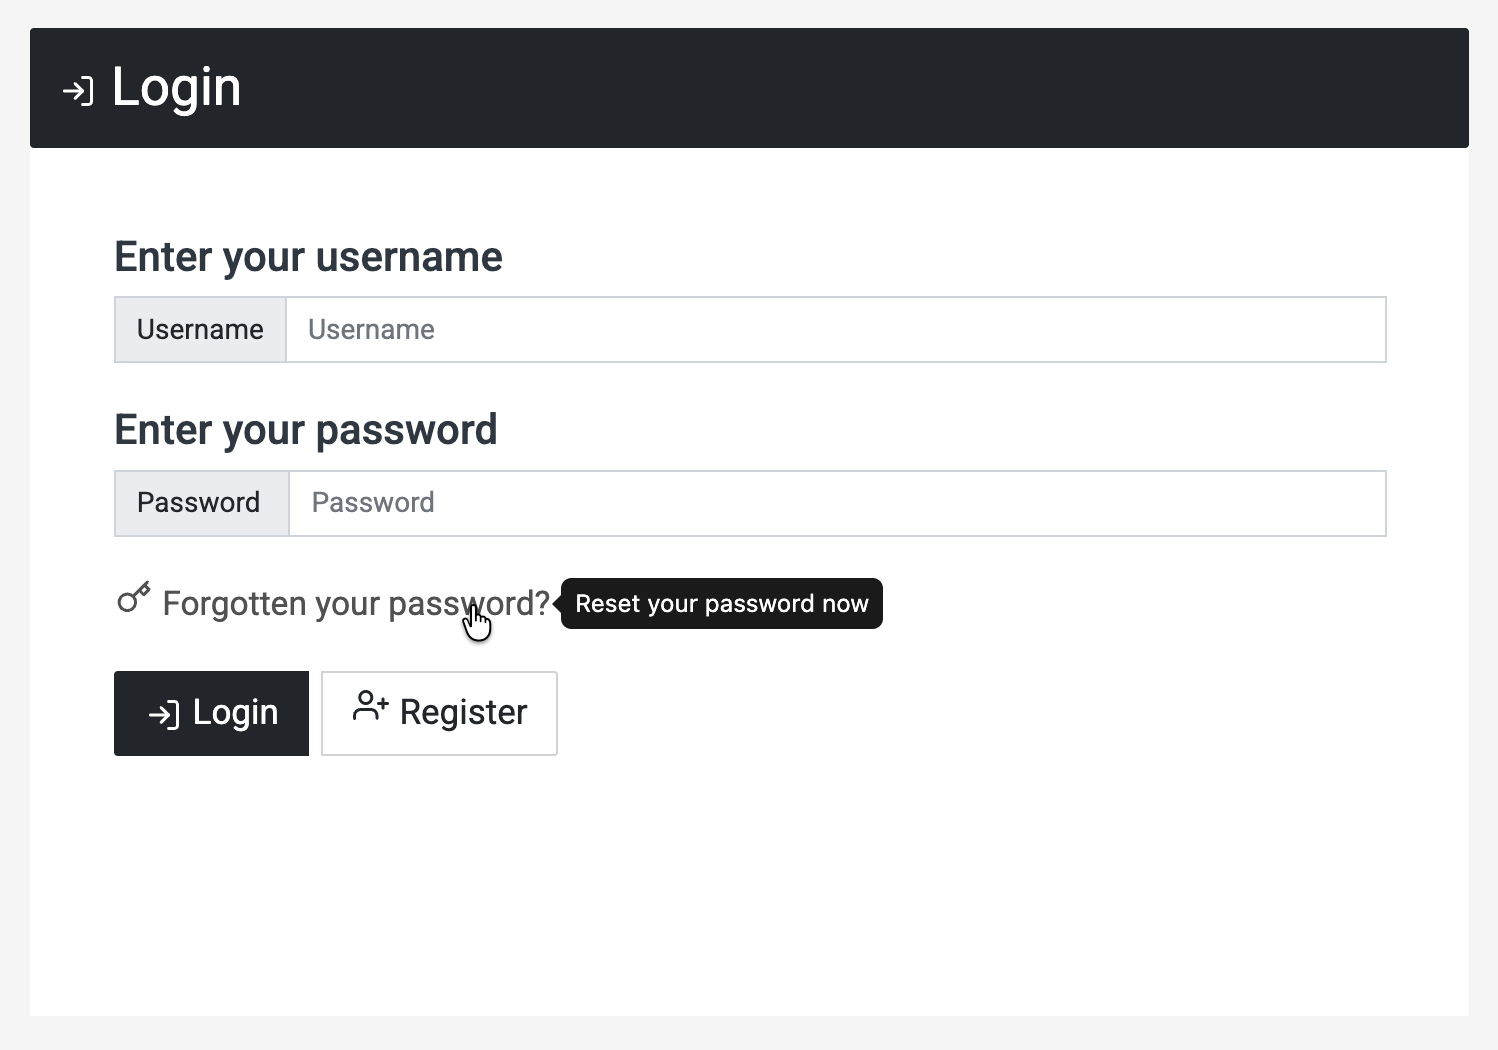
You will then be taken to the Reset Your Netsight3 Password screen:
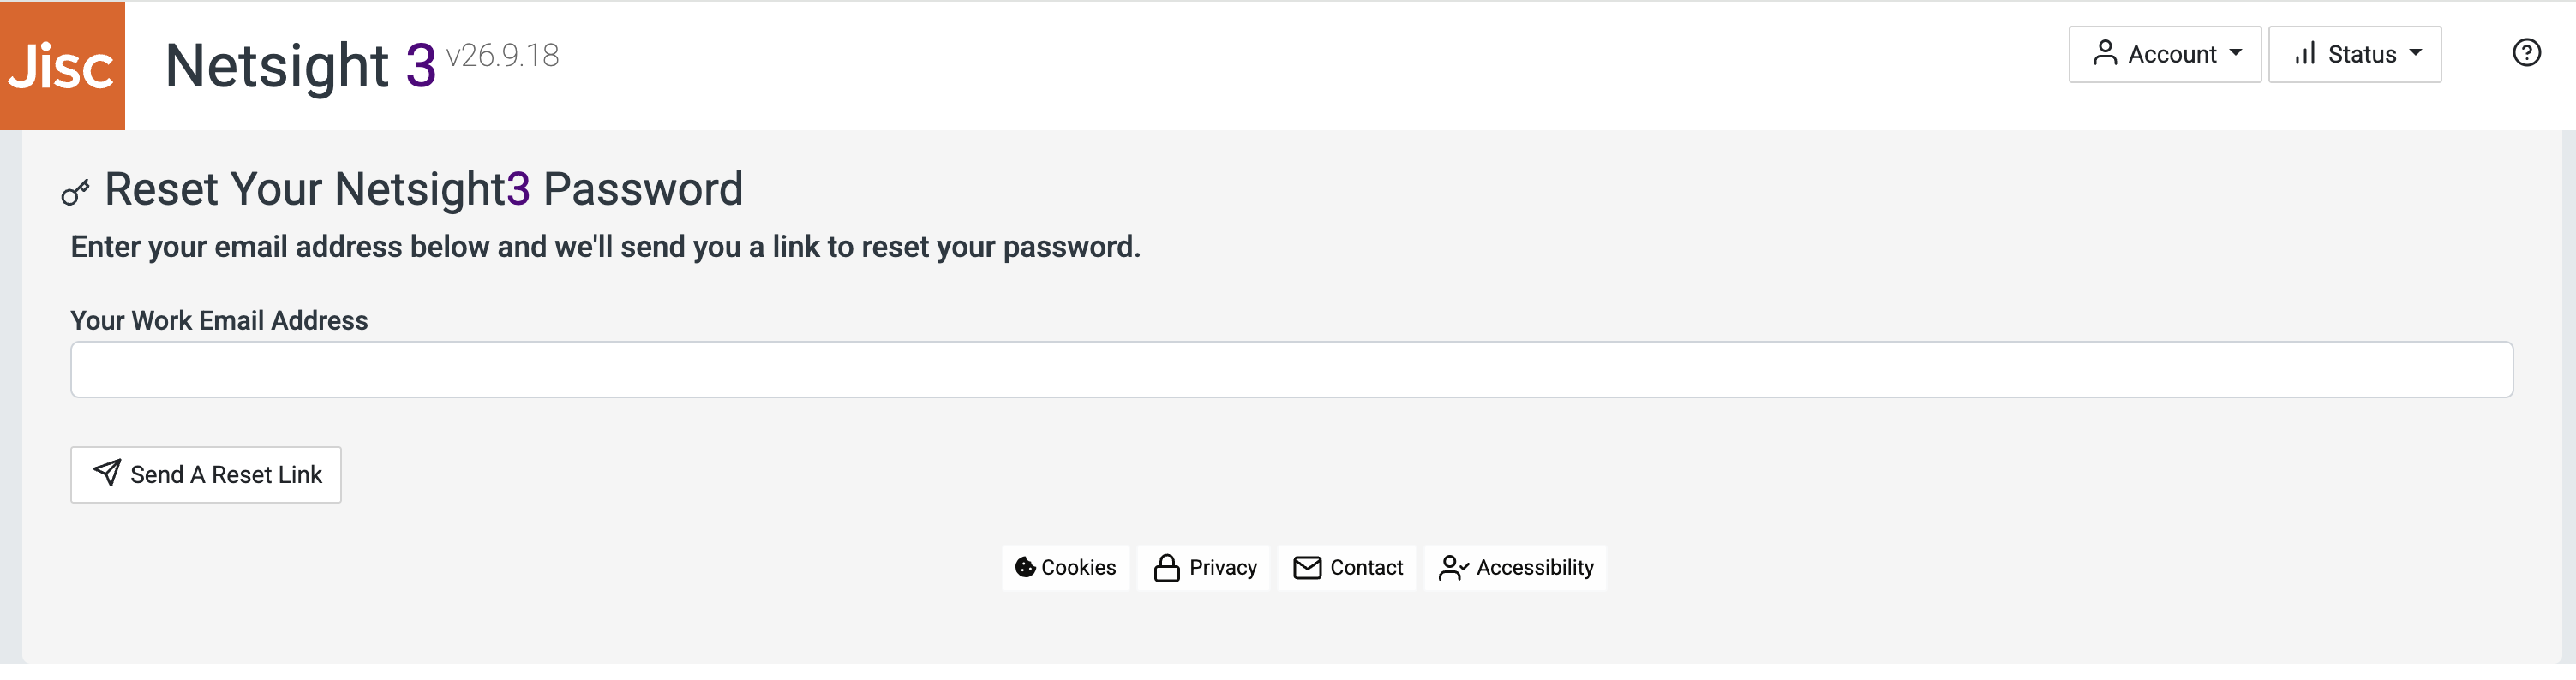
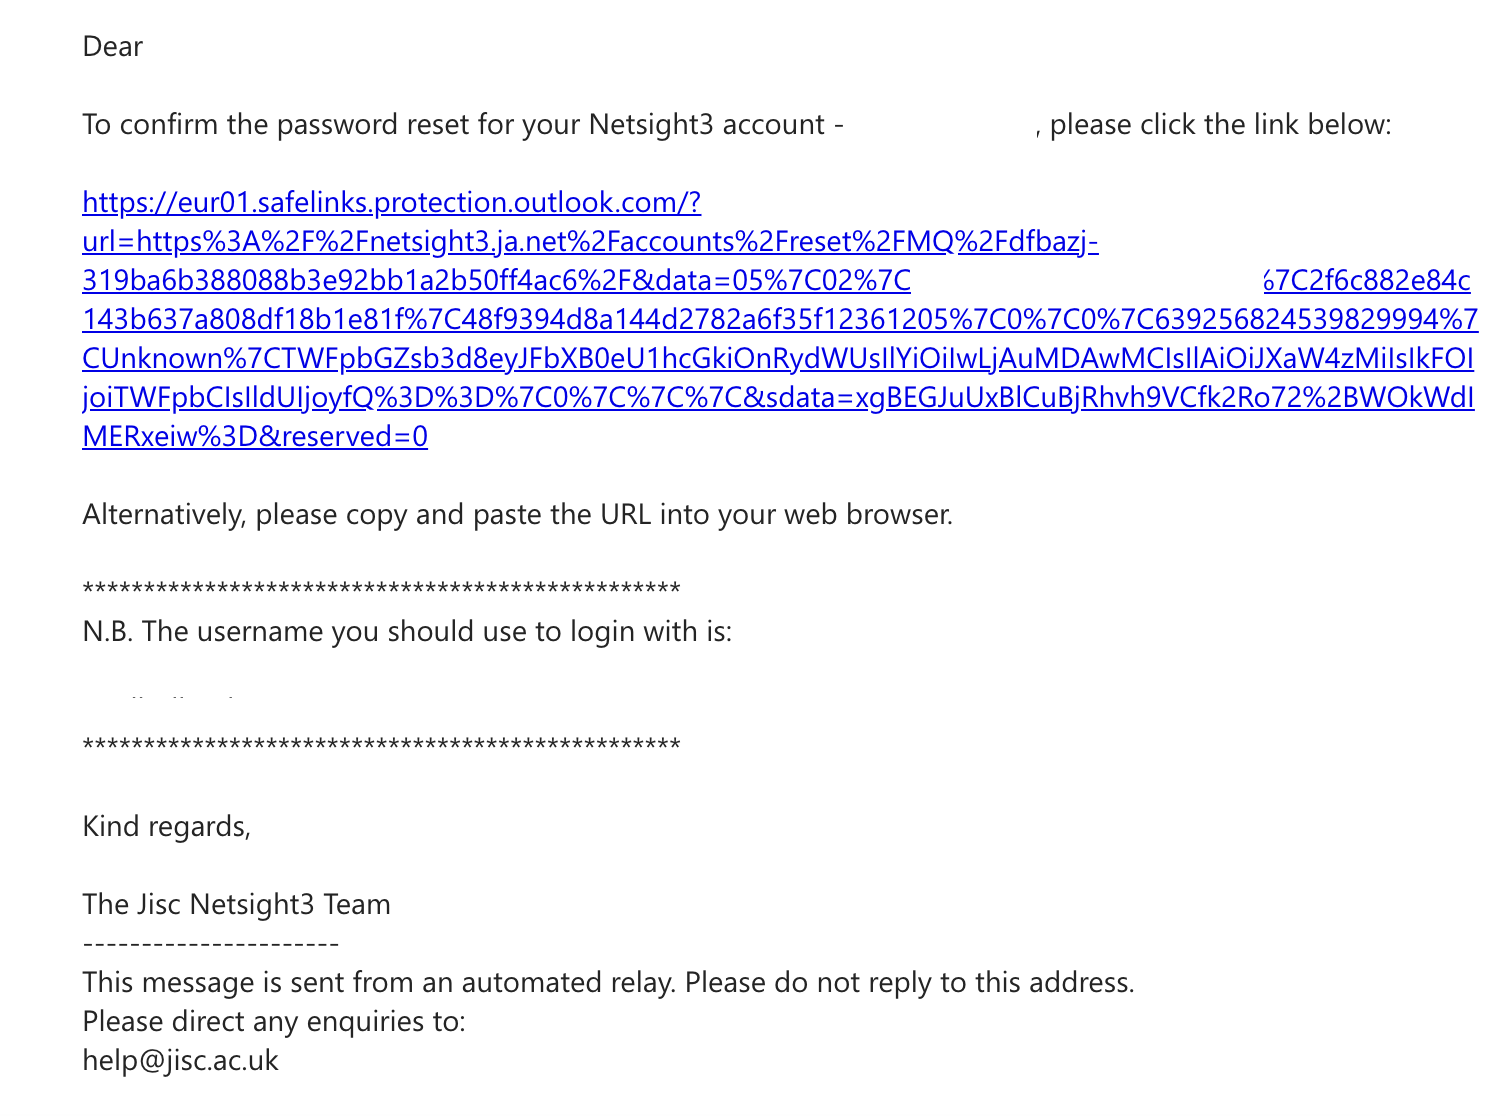
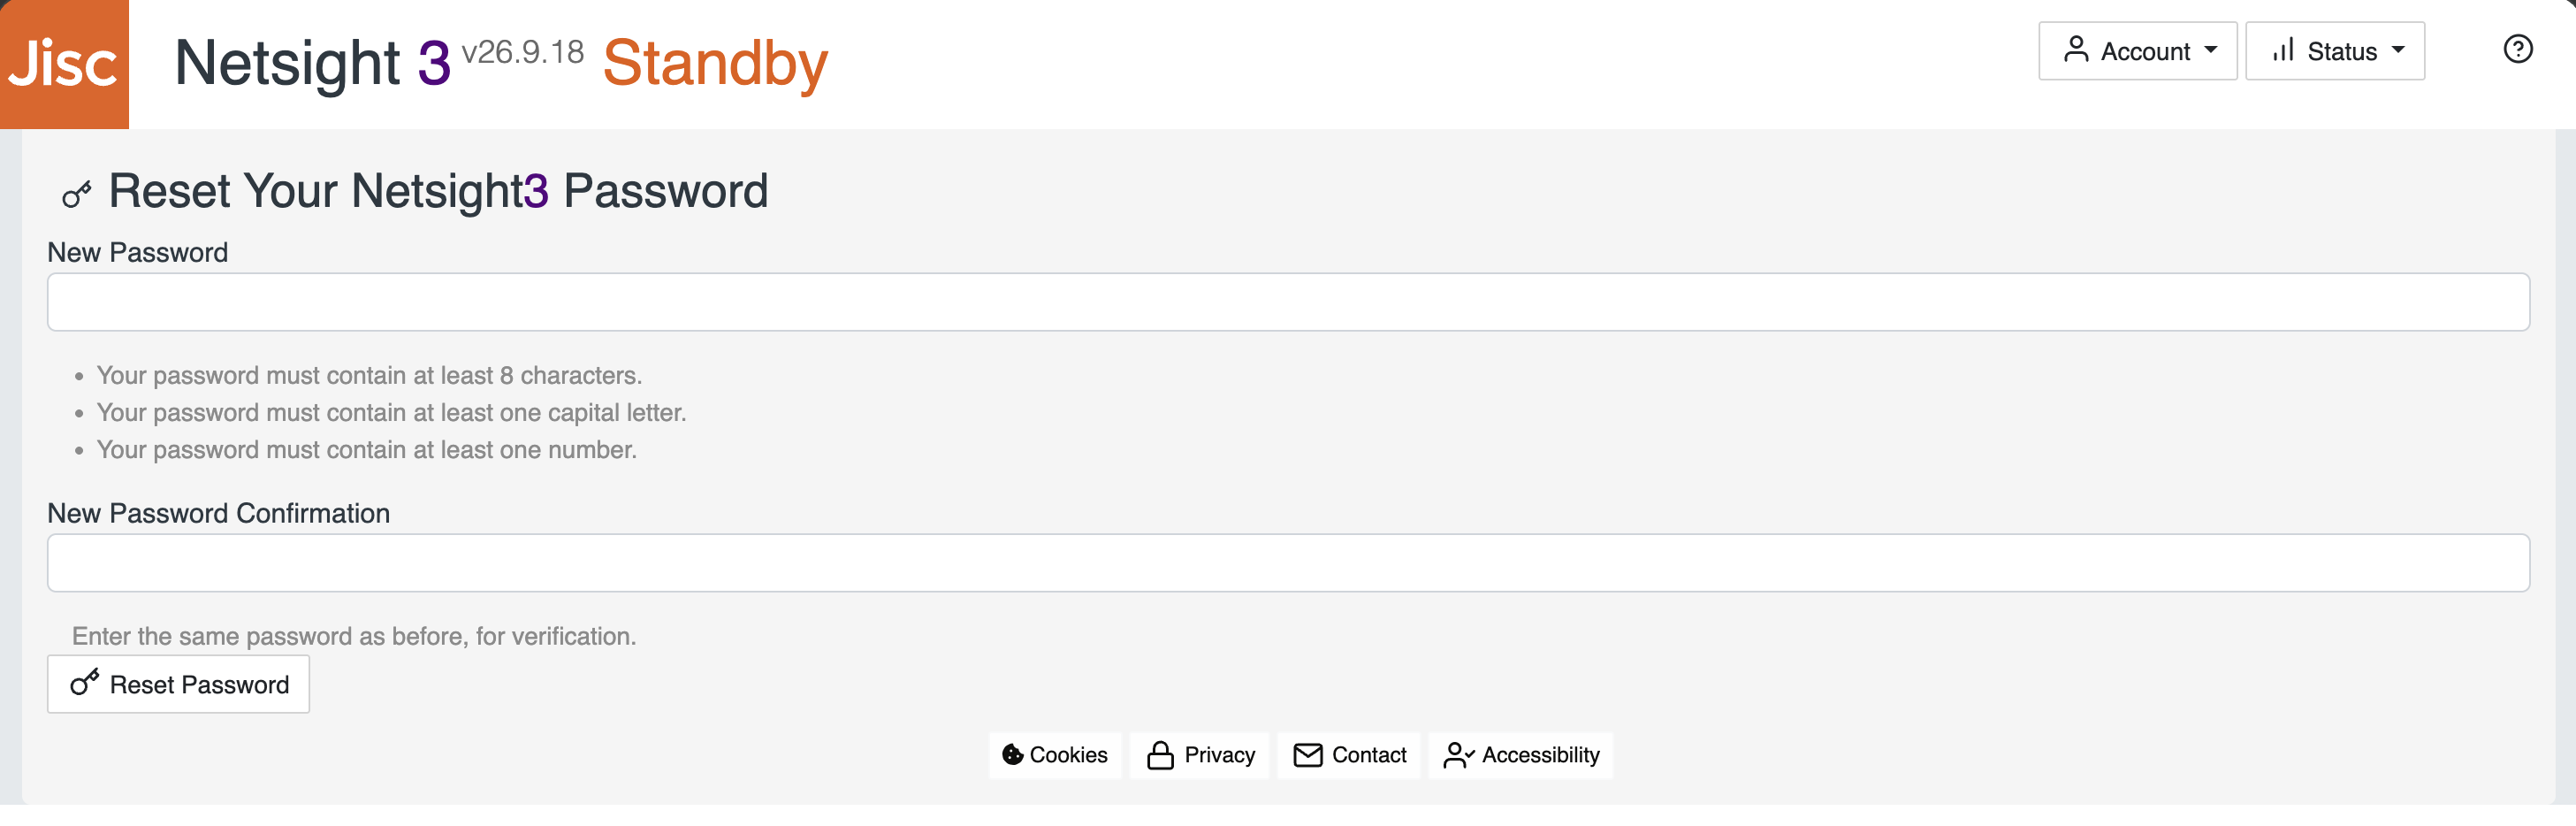
The reset process works by emailing you a one-time link to your registered work email address. This then gives access to another form where you can type in and confirm your new password.
Note that if you are currently logged in, your email address should be prefilled in the Your Work Email Address box in the form. Otherwise, you will have to type in your address.

5. My Connections
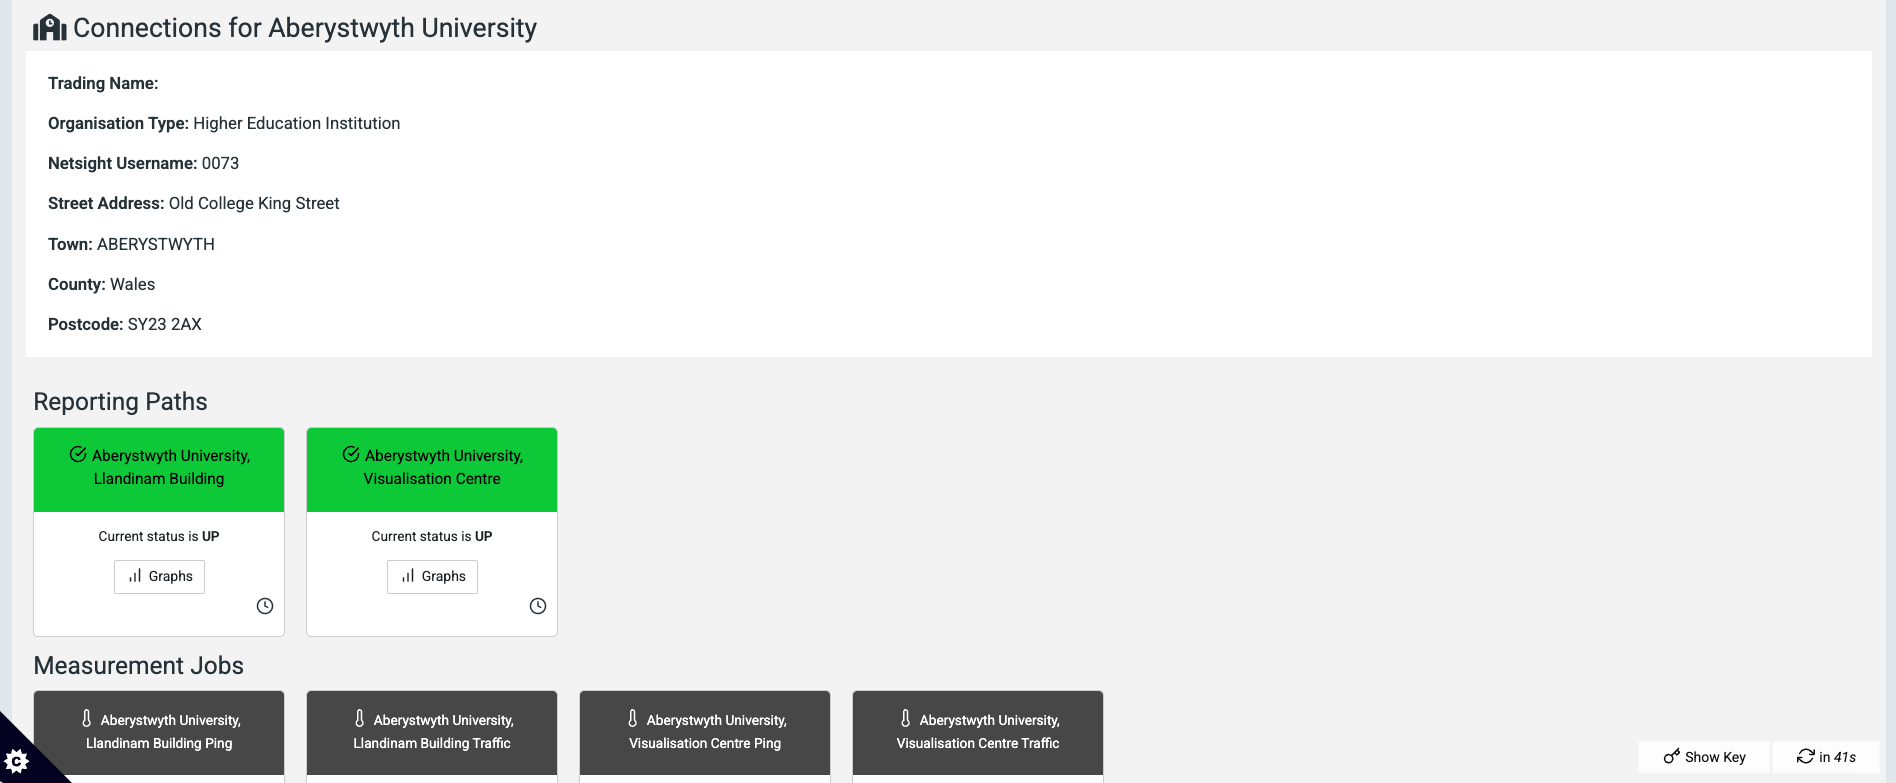
The Netsight3 My Connections view gives you access to a Traffic Lights style RAG (Red, Amber, Green) rated display of the connections belonging to your organisation. In addition, you can access graph dashboards that display the status and performance of those circuits.
5.1 Accessing the My Connections view
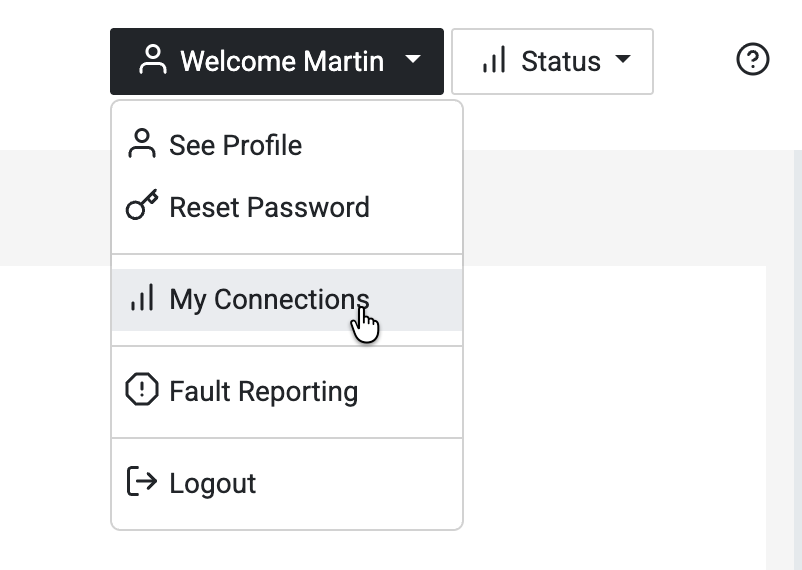
Logged-in users will have access to a My Connections page from the Welcome or Status menus.
5.2 The My Connections view sections
The My Connections view is split into four sections.
5.2.1 Organisation details
The name and contact details of your organisation are displayed at the top of the page.
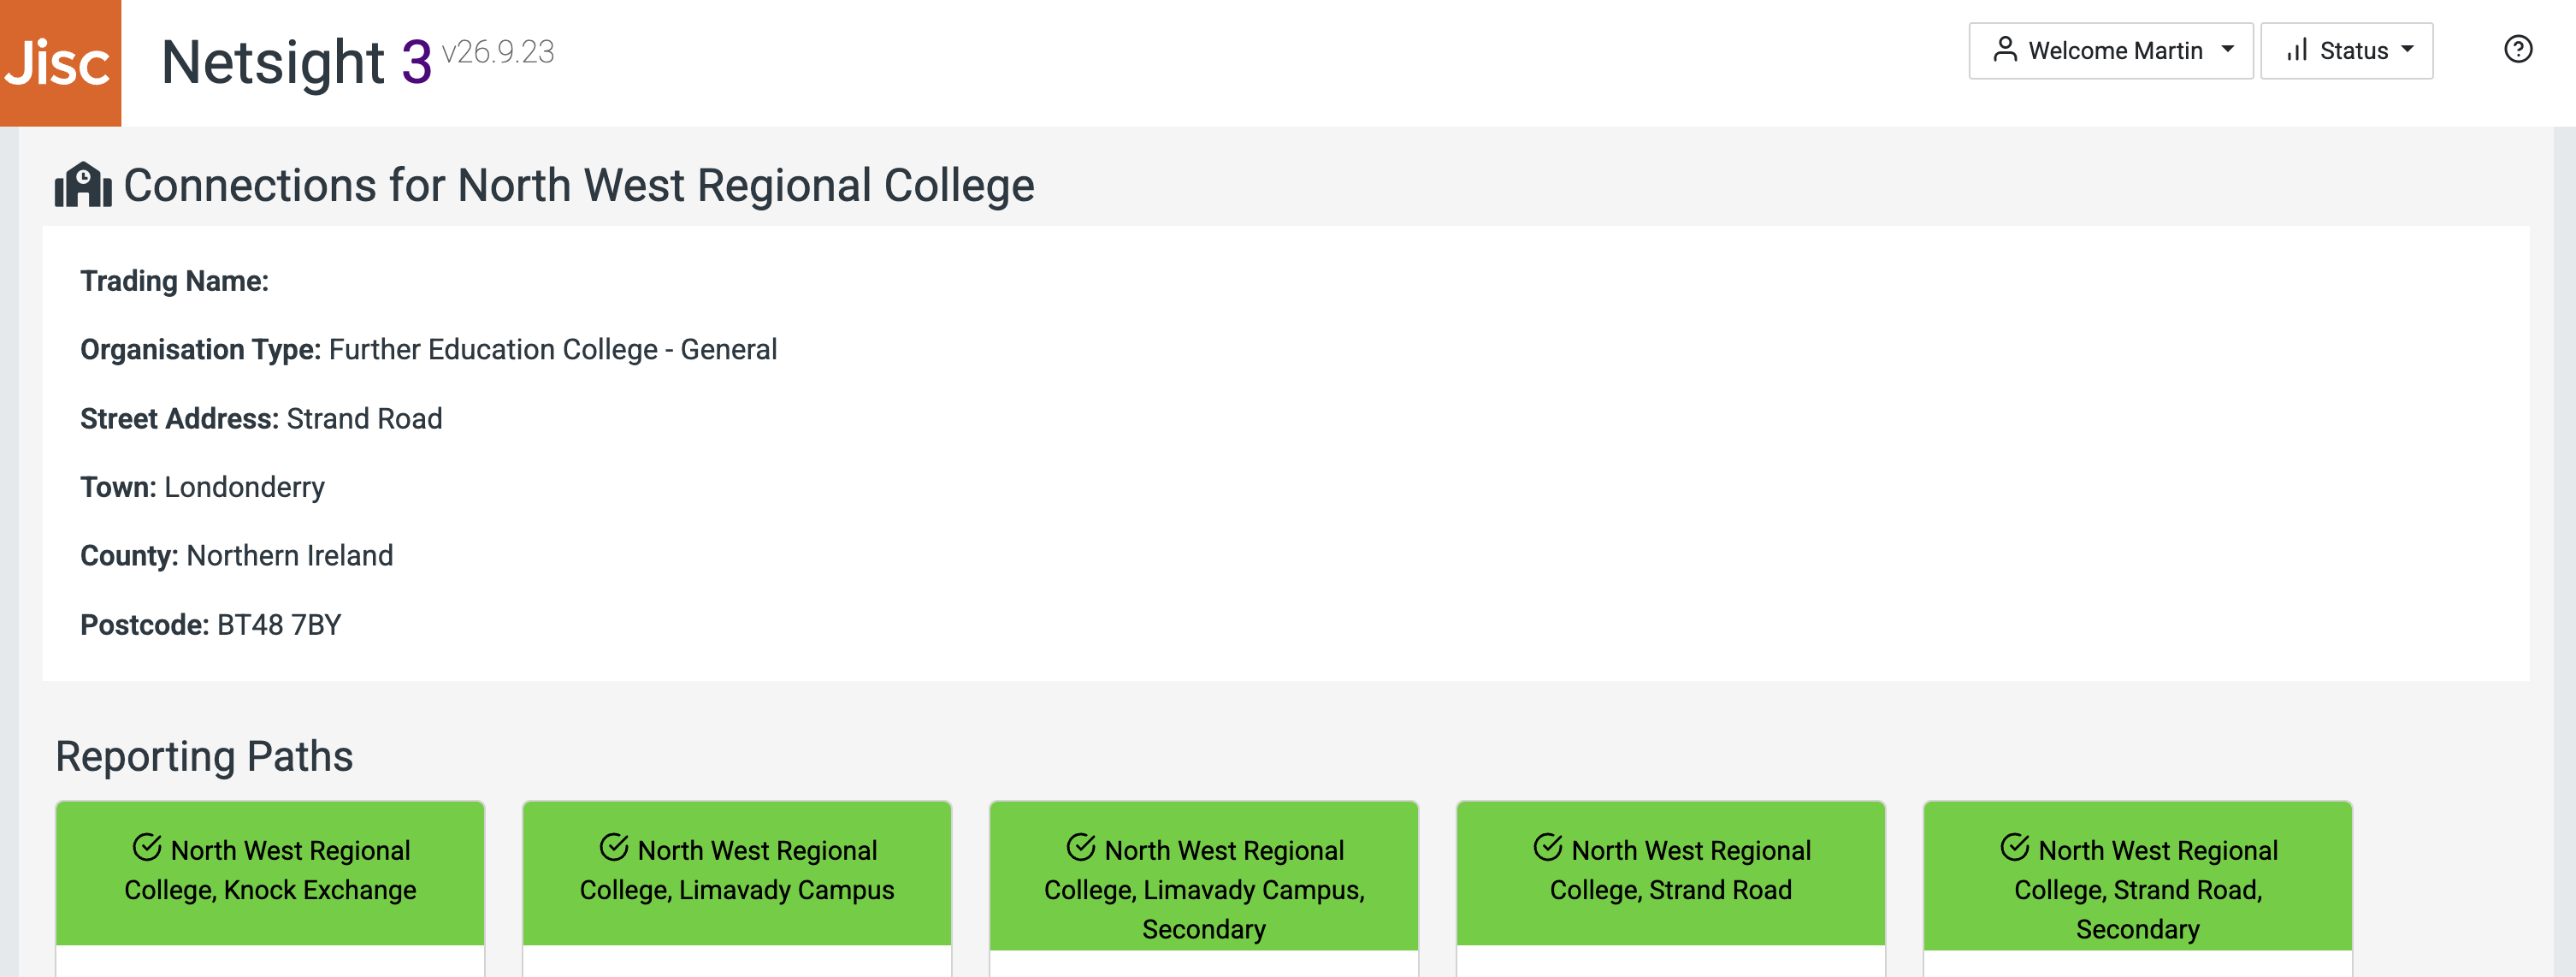
If any of these details are incorrect please contact us by emailing help@jisc.ac.uk.
5.2.2 Reporting Paths
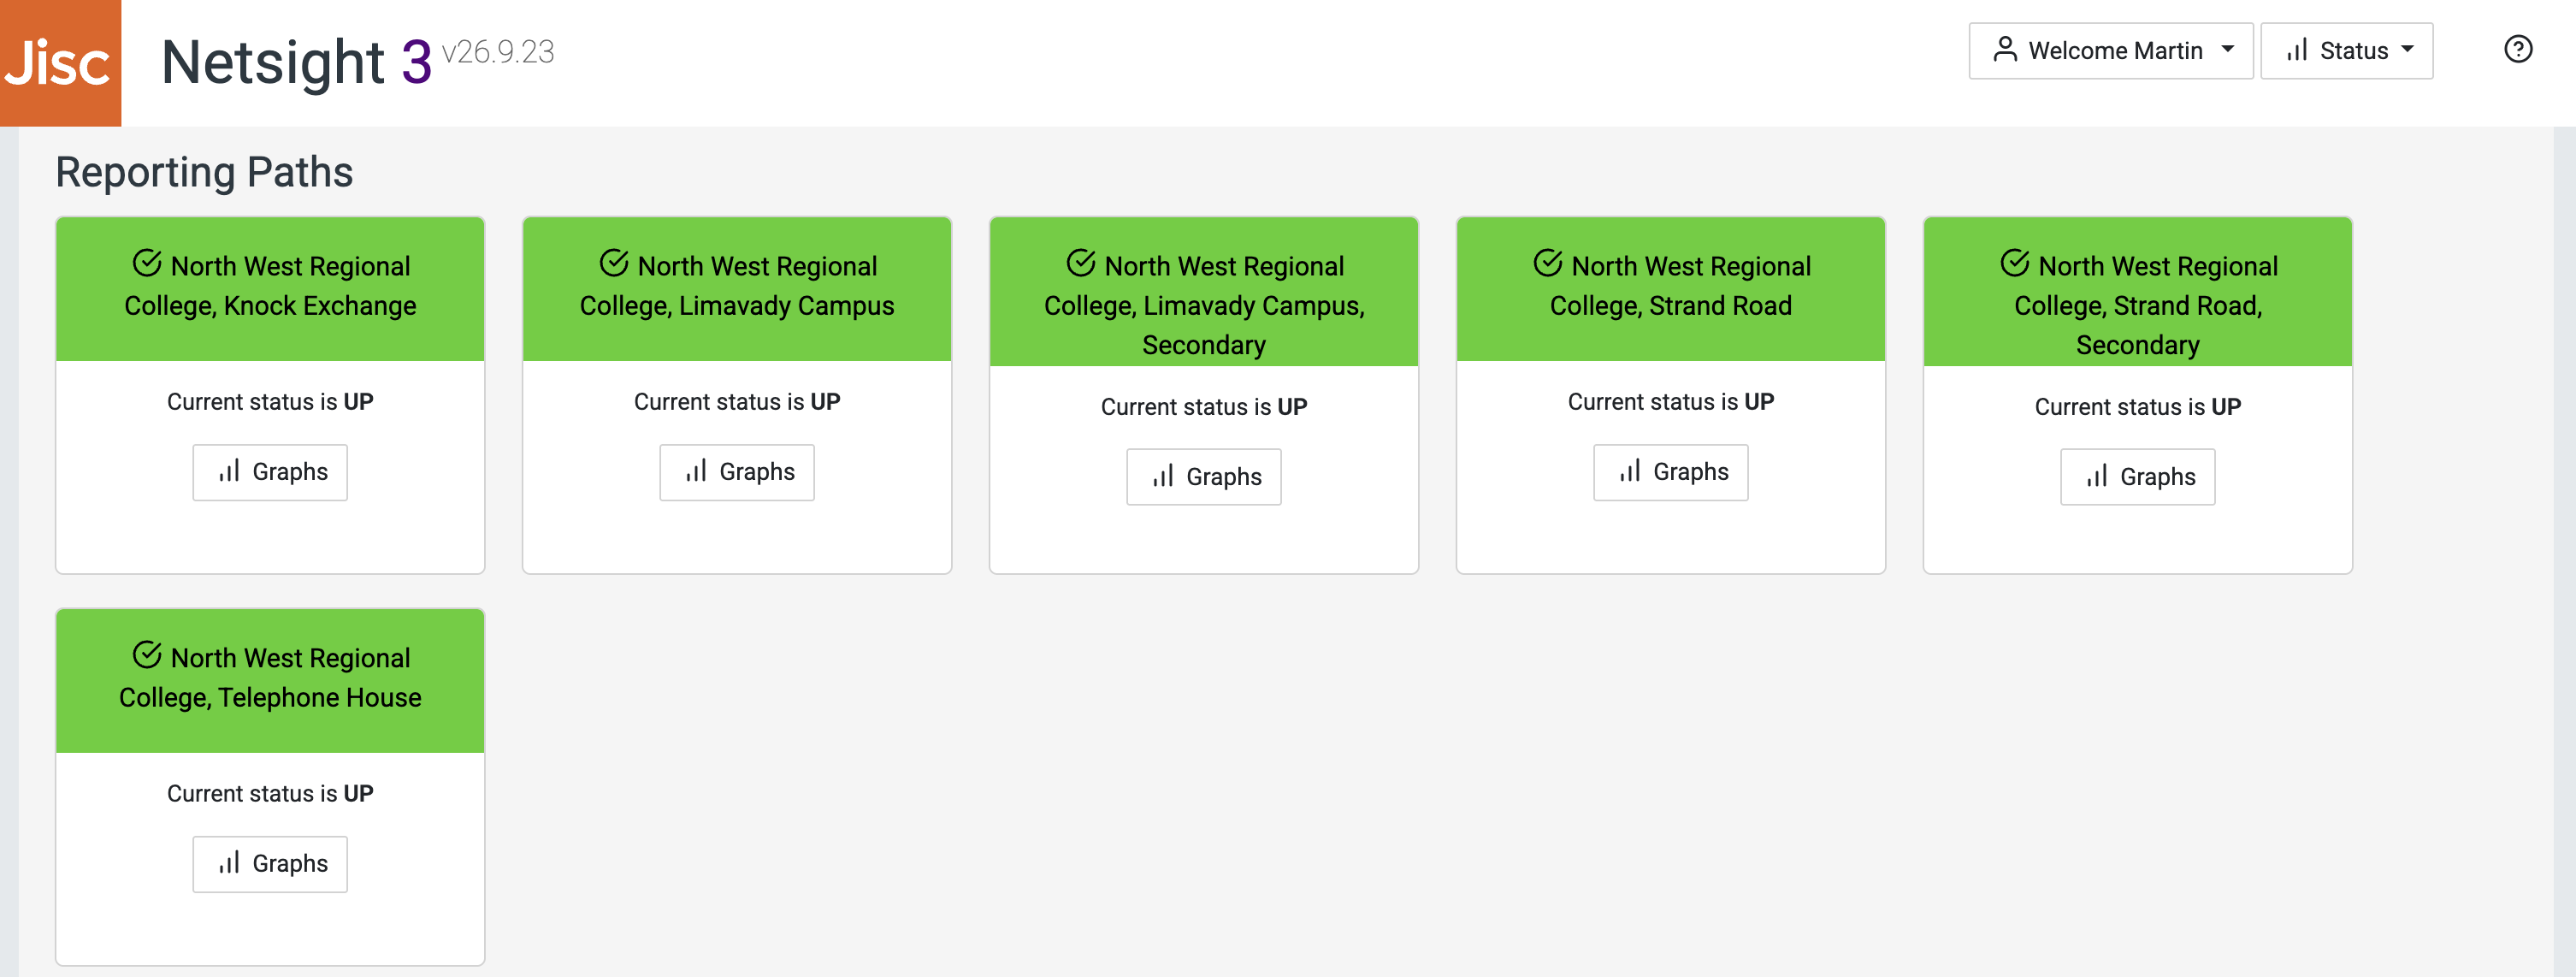
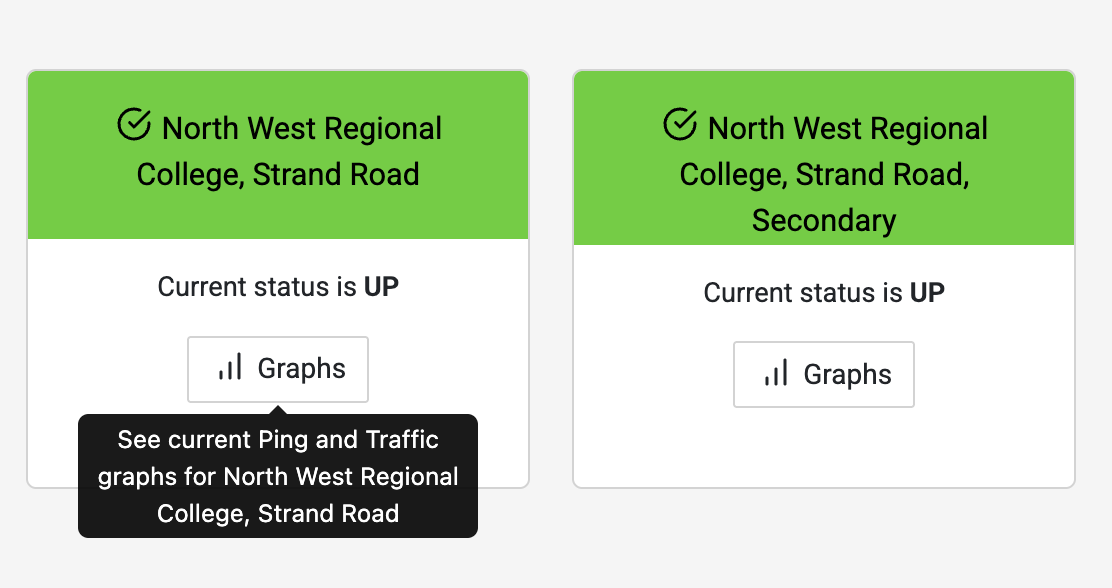
The second section lists Traffic Lights style cards for your organisation's circuits (represented on the system as Reporting Paths). These are colour coded using a RAG (Red, Amber, Green) rating and are marked as Red / Down where packet loss is greater than 90% and Amber / Degraded where packet loss is between 40% and 90%. Where packet loss is less than 40%, cards are marked as Green / Up.
5.2.3 Measurement Jobs
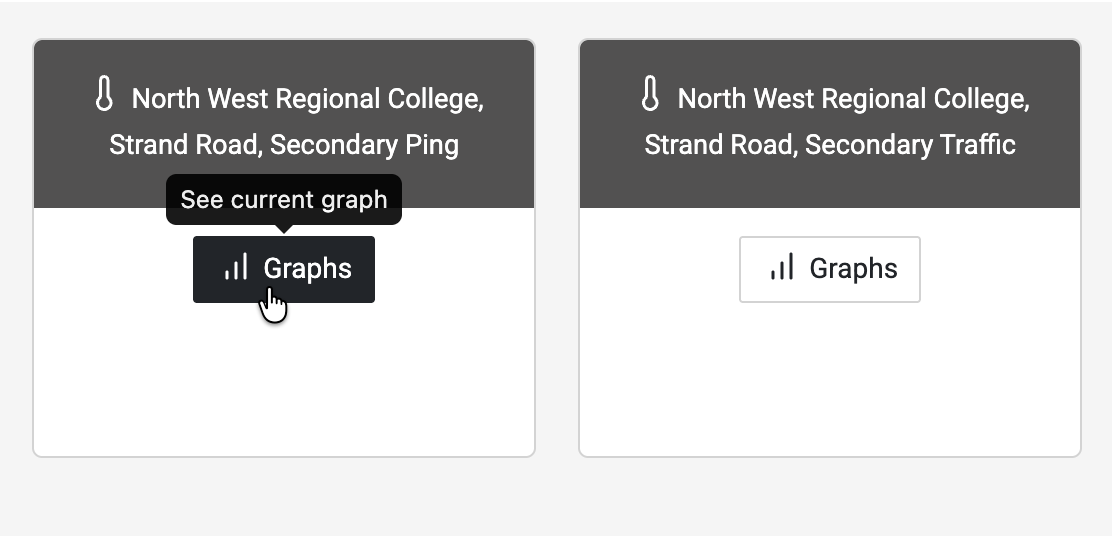
In addition to the Current Ping and Traffic graph dashboards that are accessible from the Reporting Path cards, a second Ping dashboard for each circuit is available from the corresponding Measurement Job cards in the Measurement Jobs section of the page.
5.2.4 User Accounts
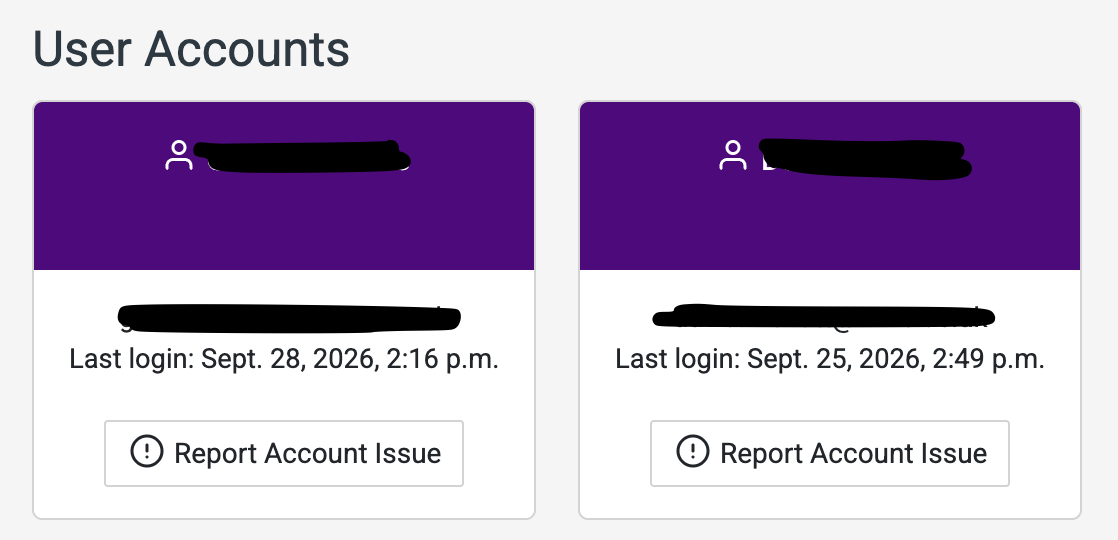
The final section on the My Connections screen lists all the user accounts for people with Netsight3 access at your organisation.
If any of the details are incorrect, or the user has left and the account needs to be removed, you can request updates by clicking on the relevant Report Account Issue button on each card.
5.3 Graph dashboards
5.3.1 Ping and Traffic dashboards
A graphing dashboard is available for each Reporting Path / circuit, and includes graphs for the current ping and traffic data. This can be accessed by clicking on the Graphs button on the relevant Reporting Path card.
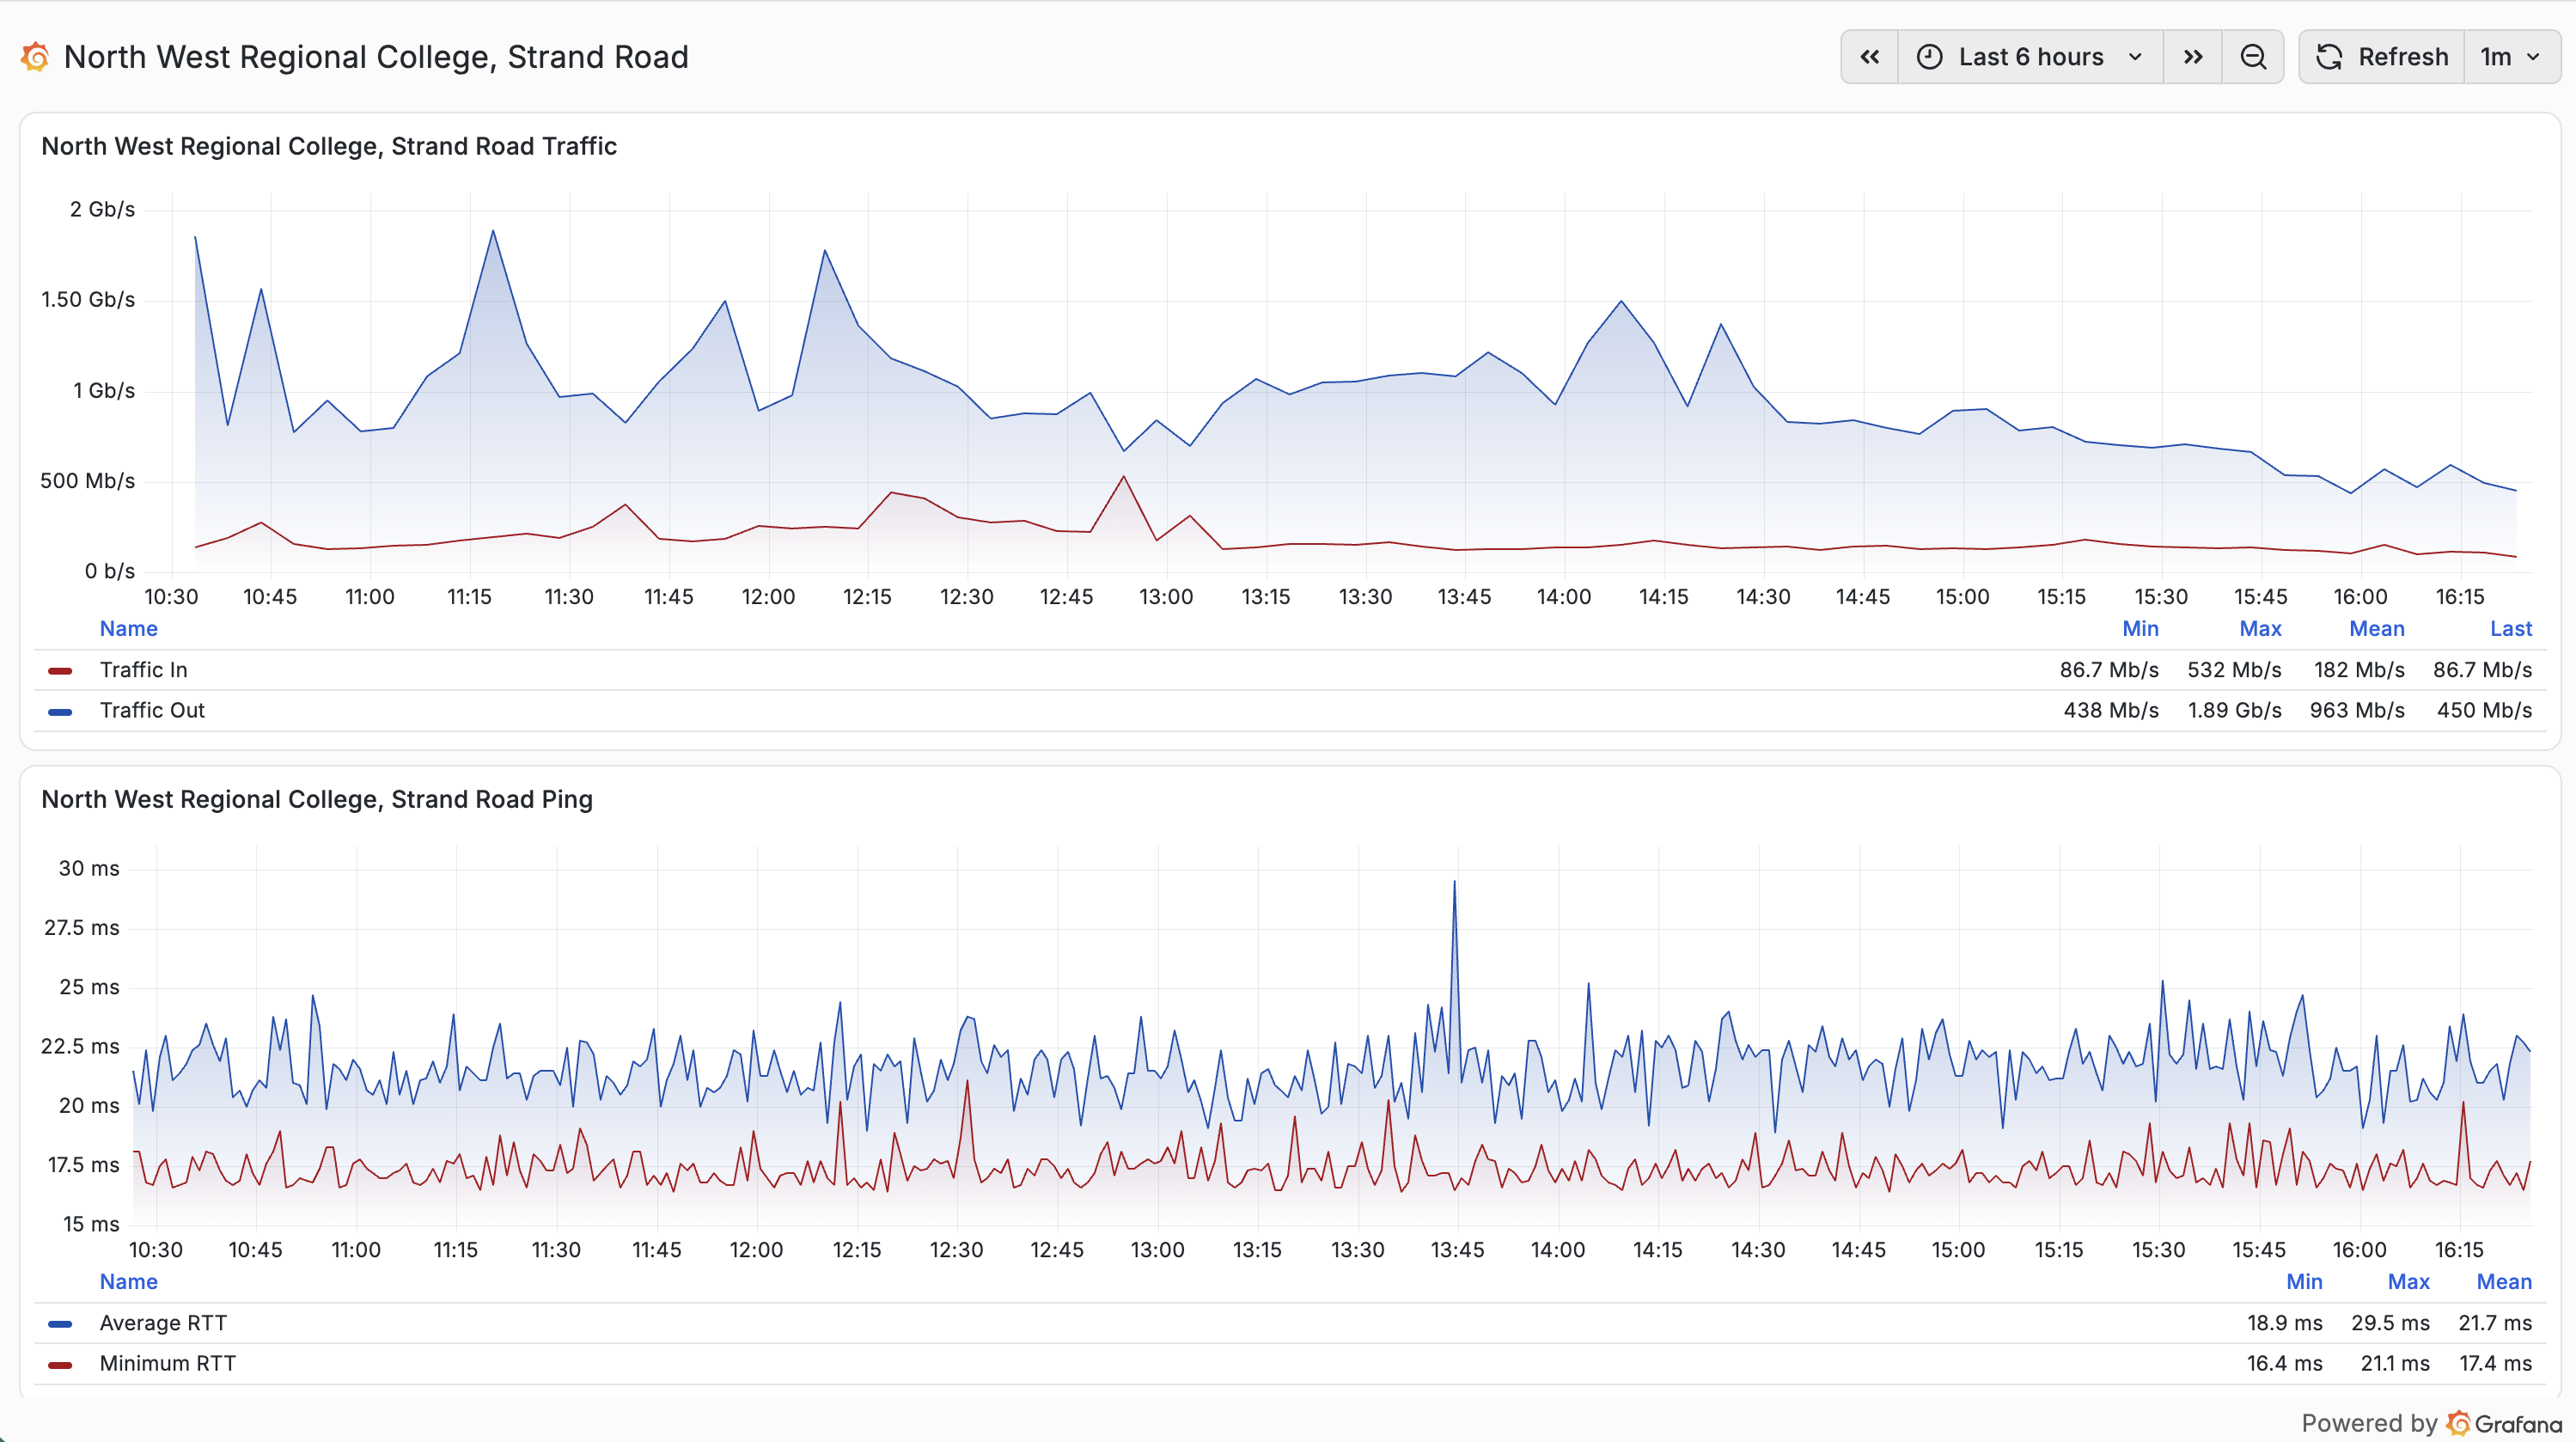
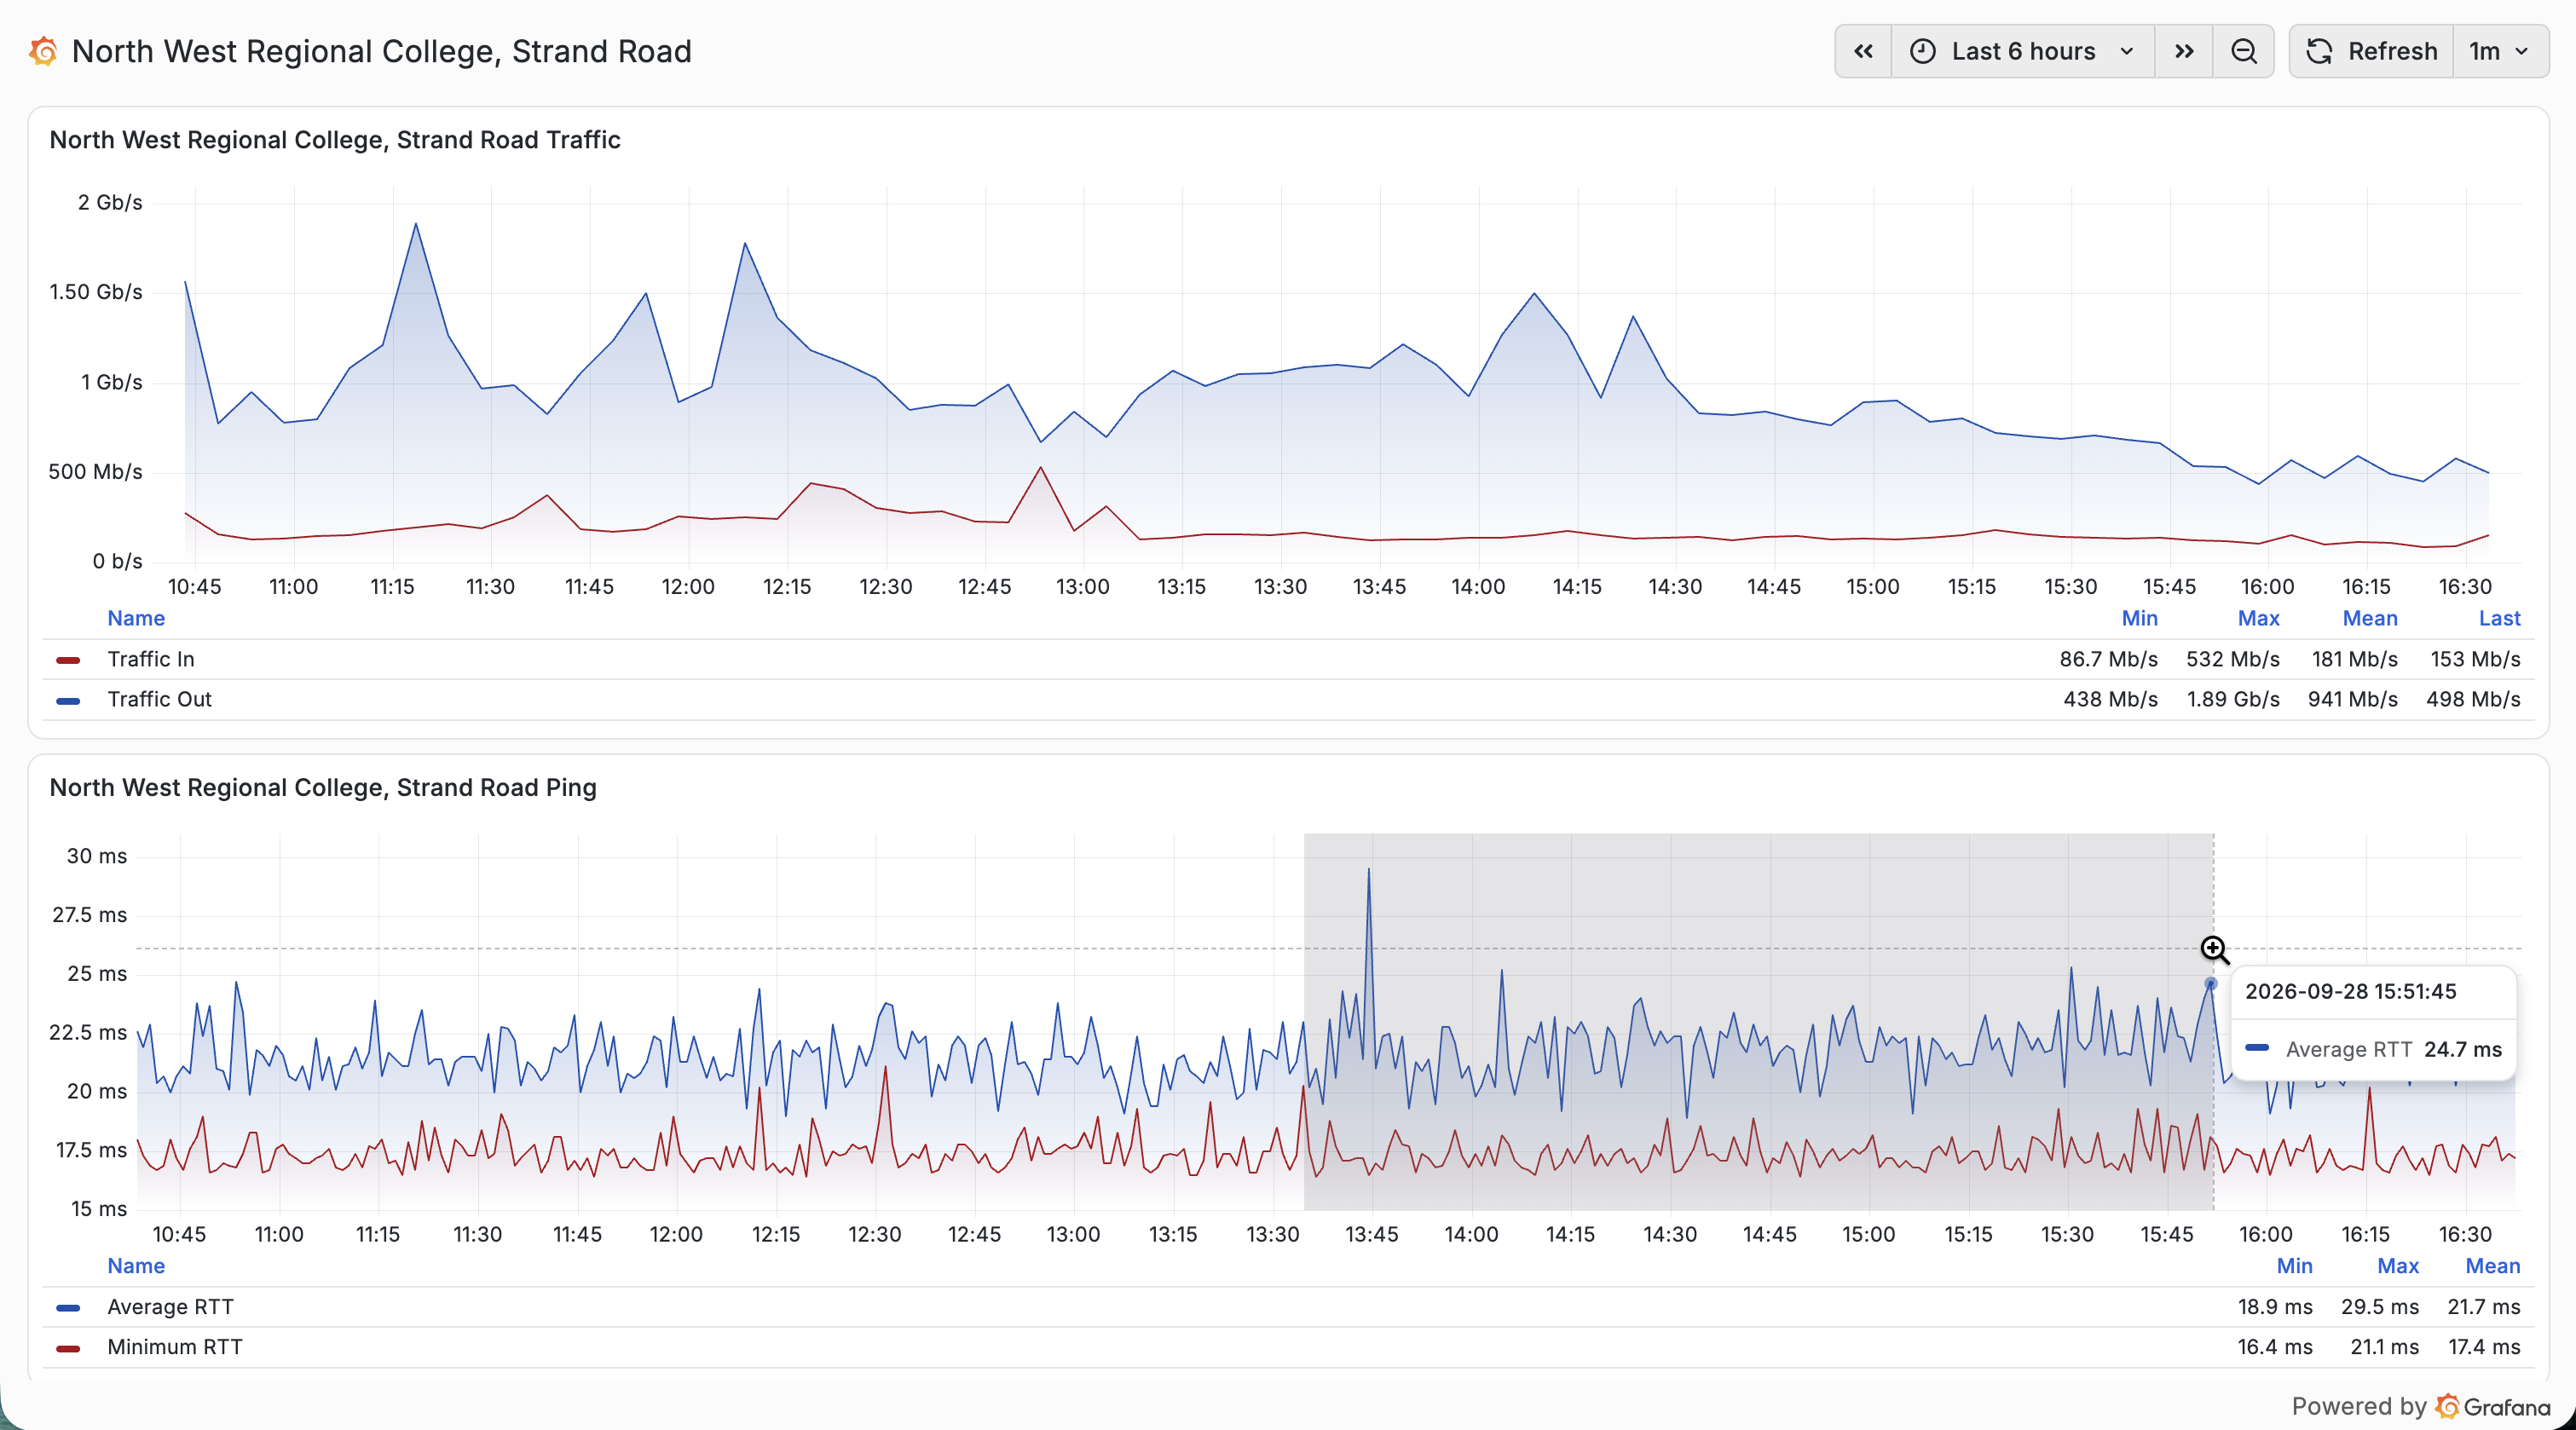
The top graph on the dashboard shows Traffic In (in red) and Traffic Out (in blue) for the connection in megabits per second. Traffic data is gathered via SNMP one every five minutes. Note that traffic data is gathered at the Jisc Janet end of each connection. This means that Traffic In equals traffic flow out from the customer organisation back into the network core. Traffic Out is the flow from the Janet core out to customer organisations.
The bottom graph shows Average (blue) and Minimum (red) ping round-trip times for the connection in milliseconds. Ping polling is done every minute and ten pings are sent to produce these averages.
5.3.2 Ping and Packet Loss dashboards
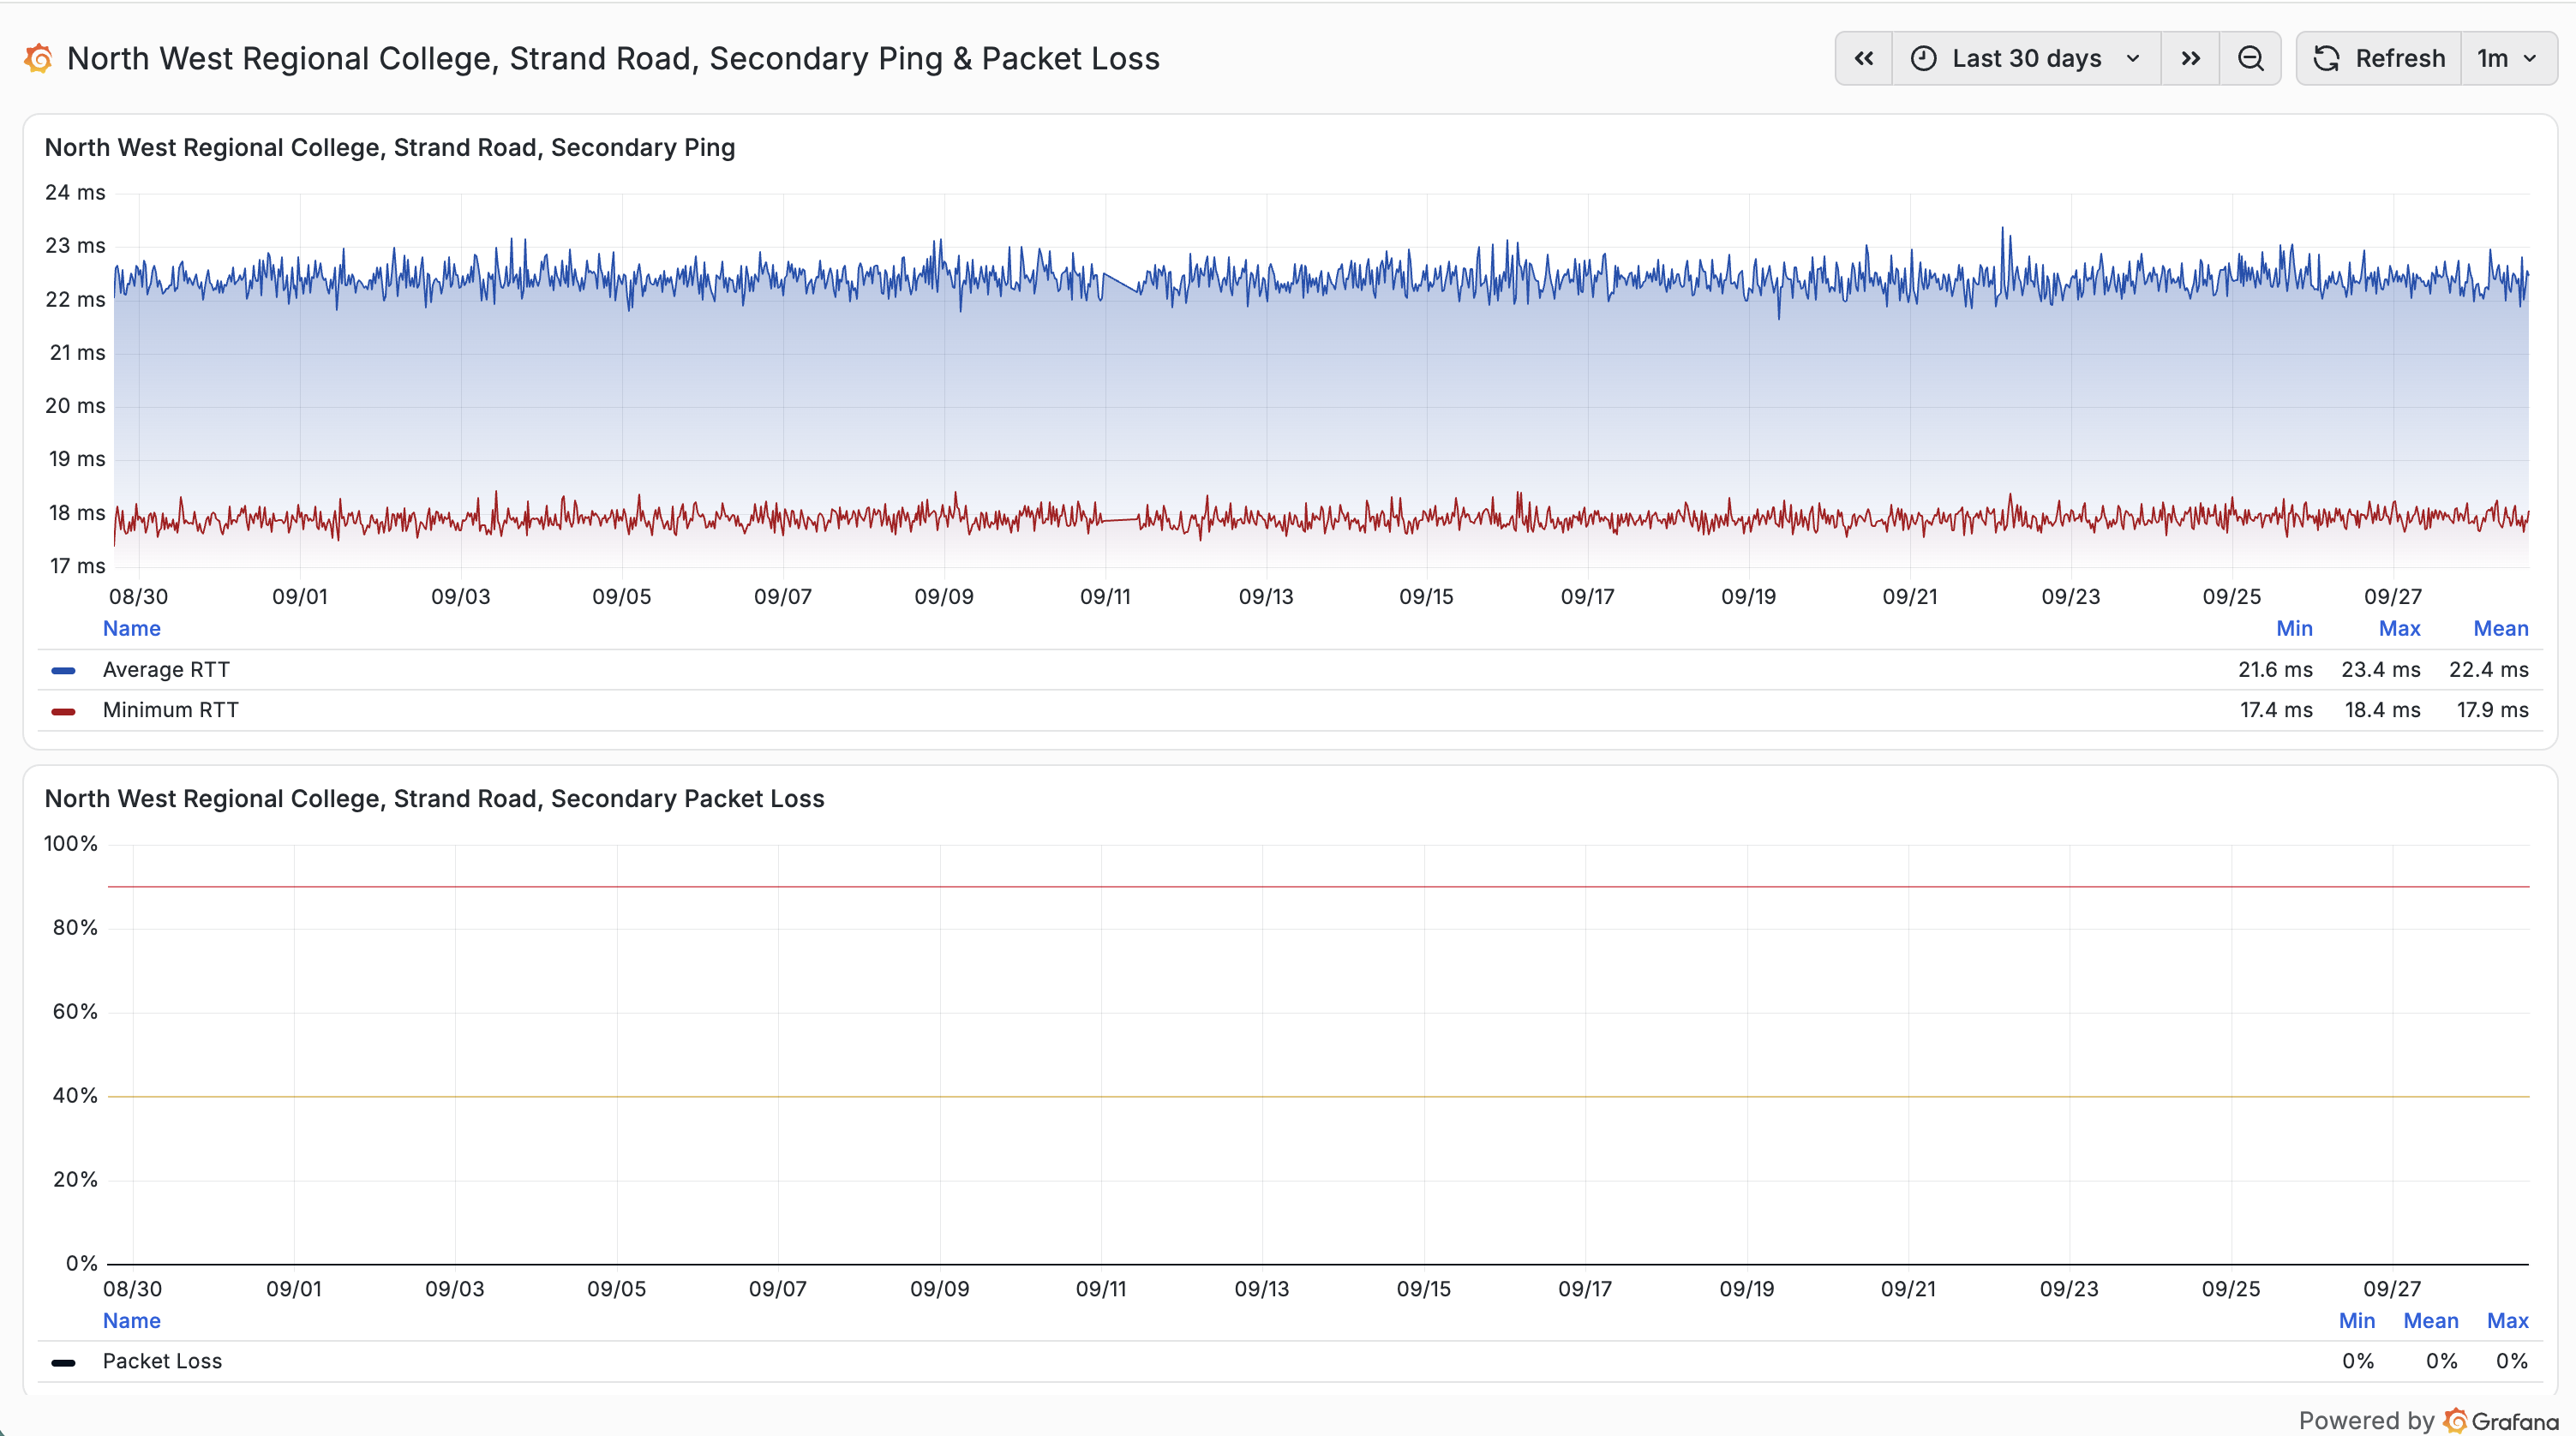
In addition to the Current Ping and Traffic dashboards that are accessible from the Reporting Path cards, a Ping and Packet Loss dashboard for each circuit is available from the corresponding Measurement Job cards in the Measurement Jobs section of the page.
5.3.3 Adjusting graph date ranges
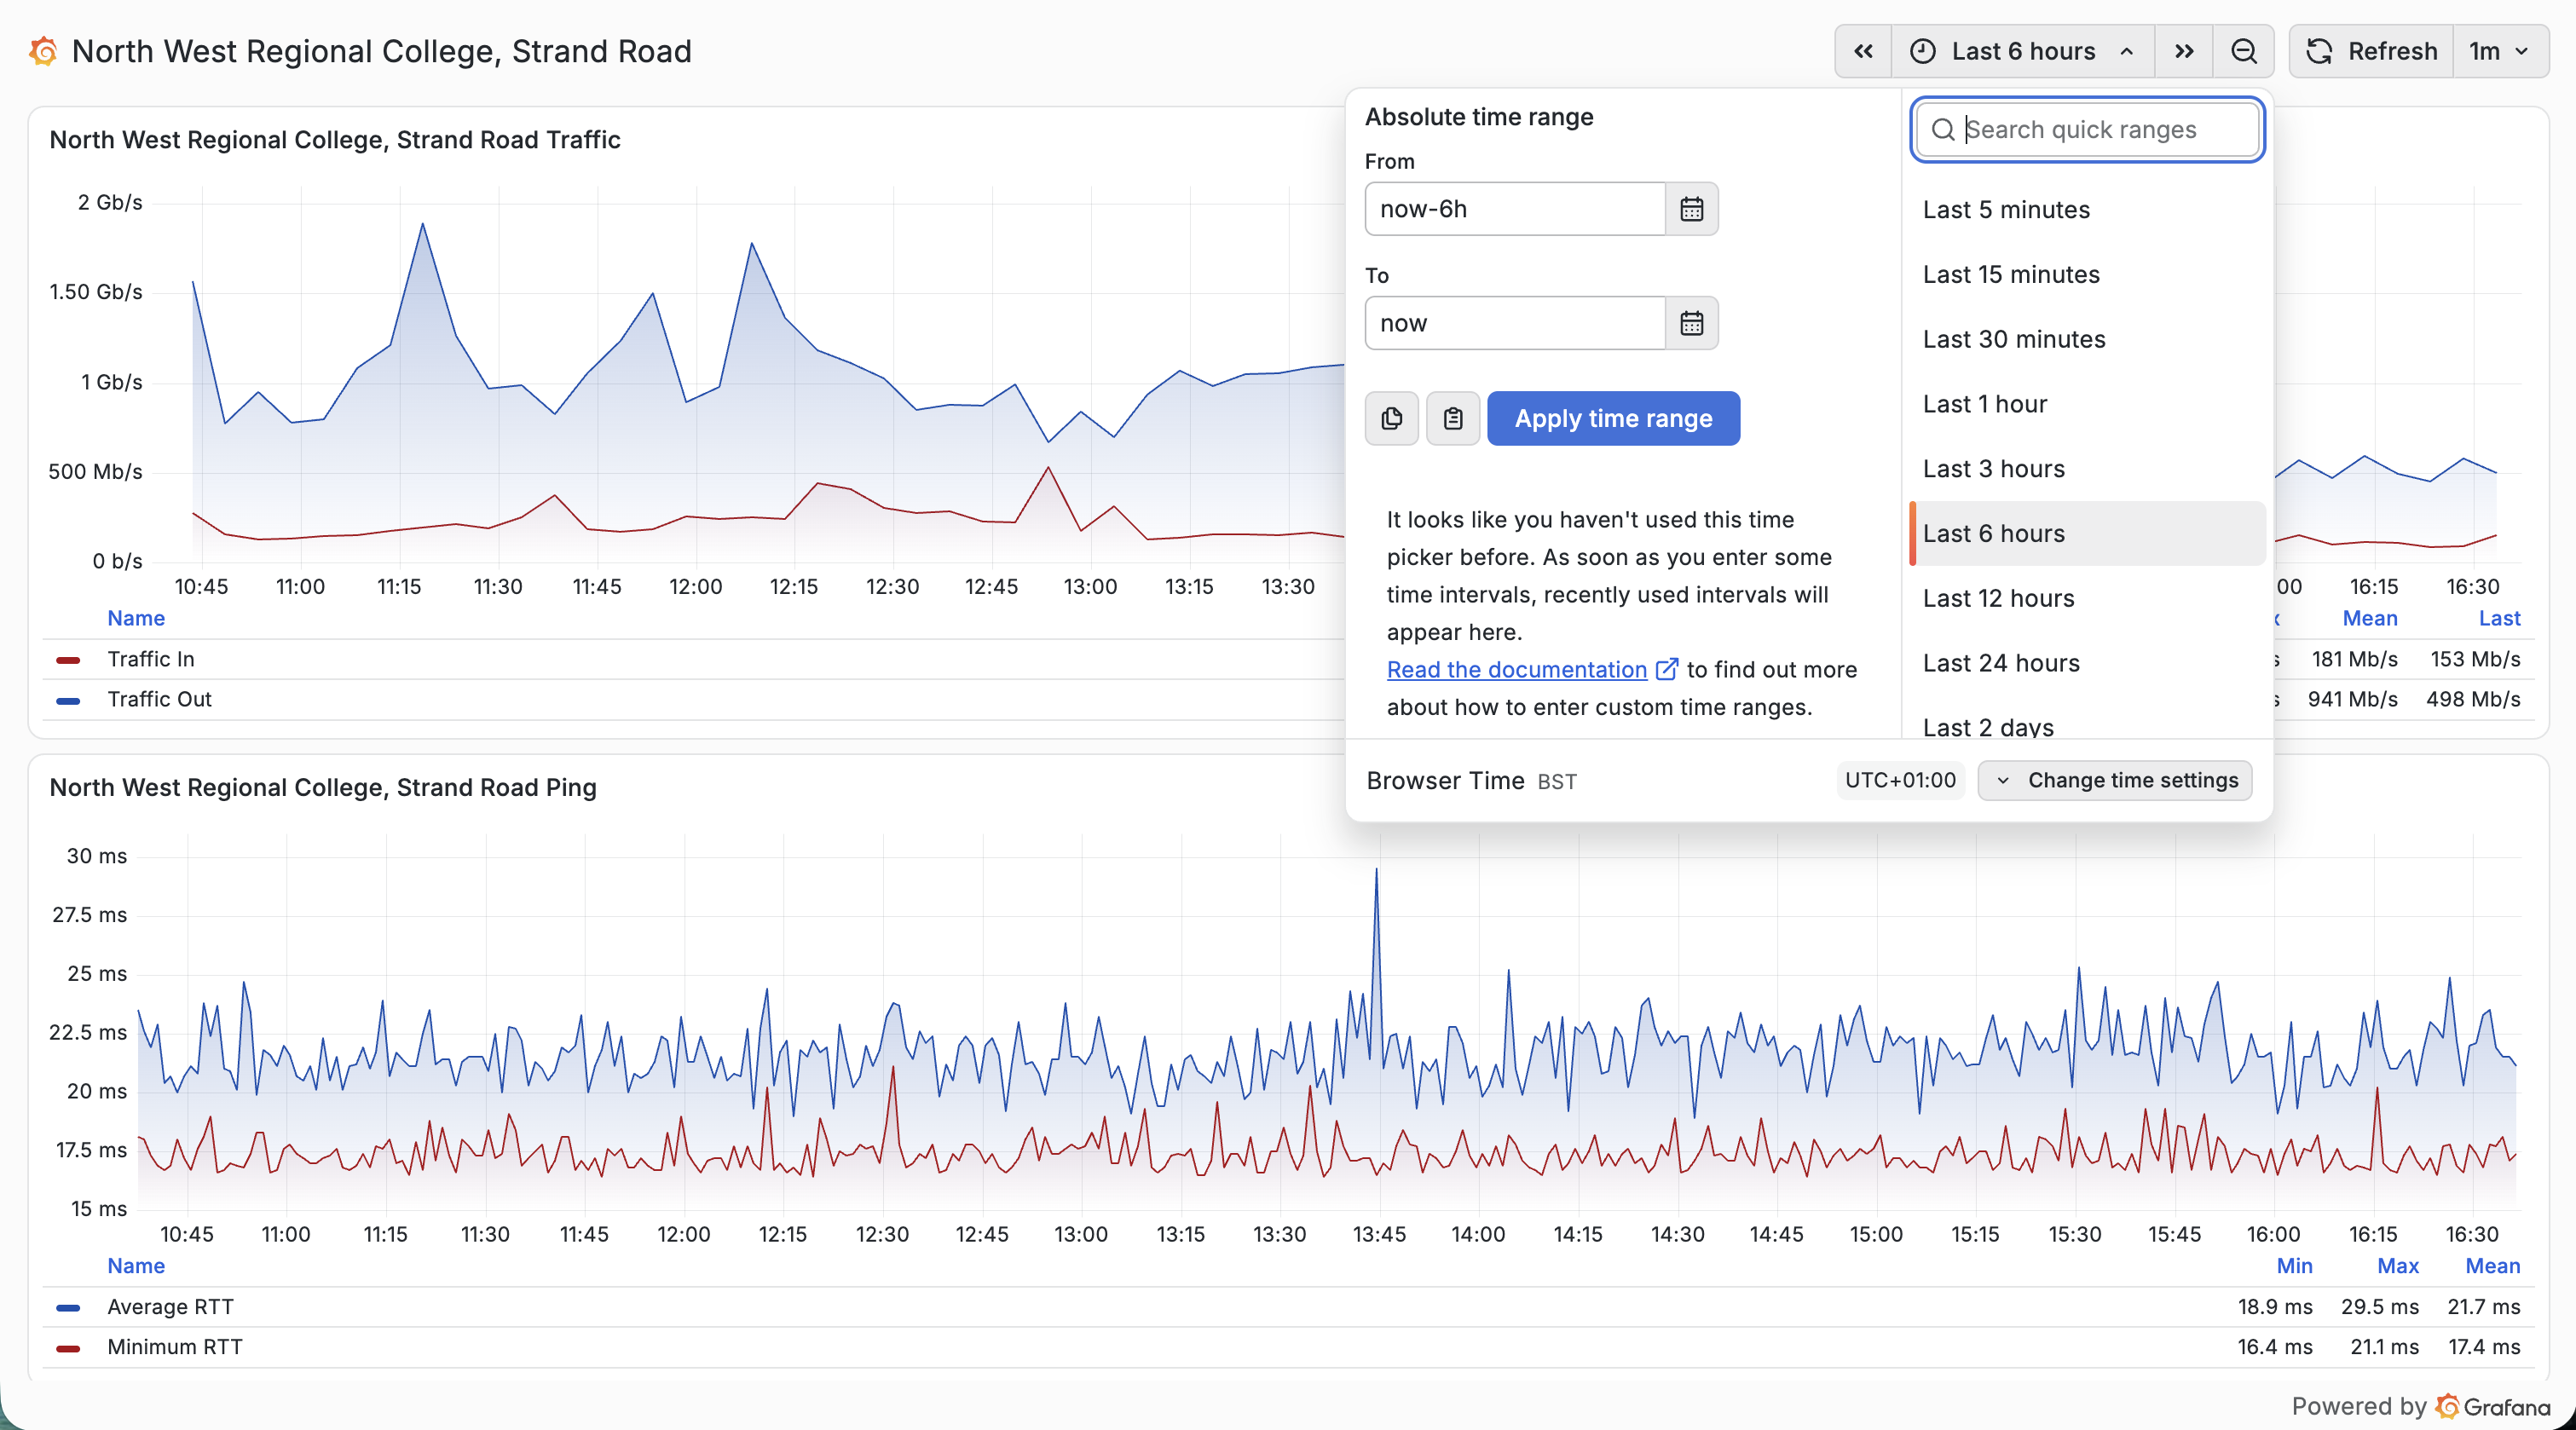
You can change the date range for any graphs on the Netsight3 system either by using the button in the top right of the screen or by clicking, dragging and highlighting a section on the graph itself. This applies to every graph published on Netsight3.
6. Janet Network Status - Home page
N.B. The home page is publicly visible without having to log in. Access to view the status of circuits in each region requires authentication.
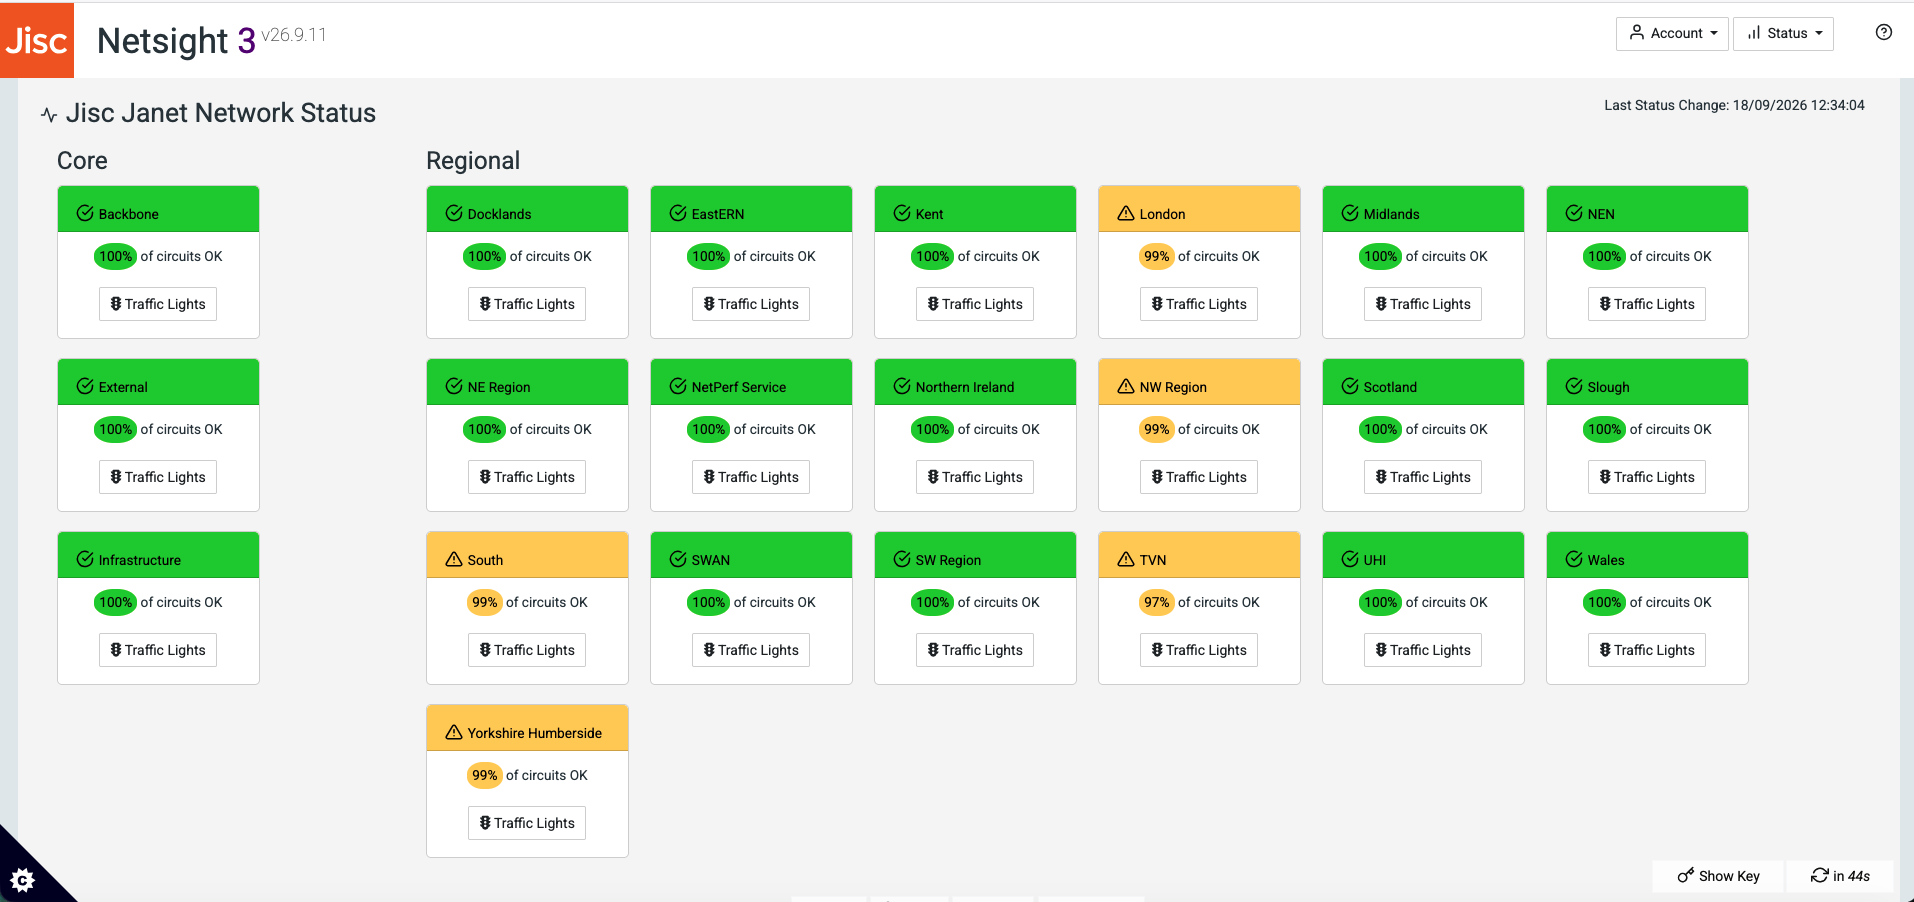
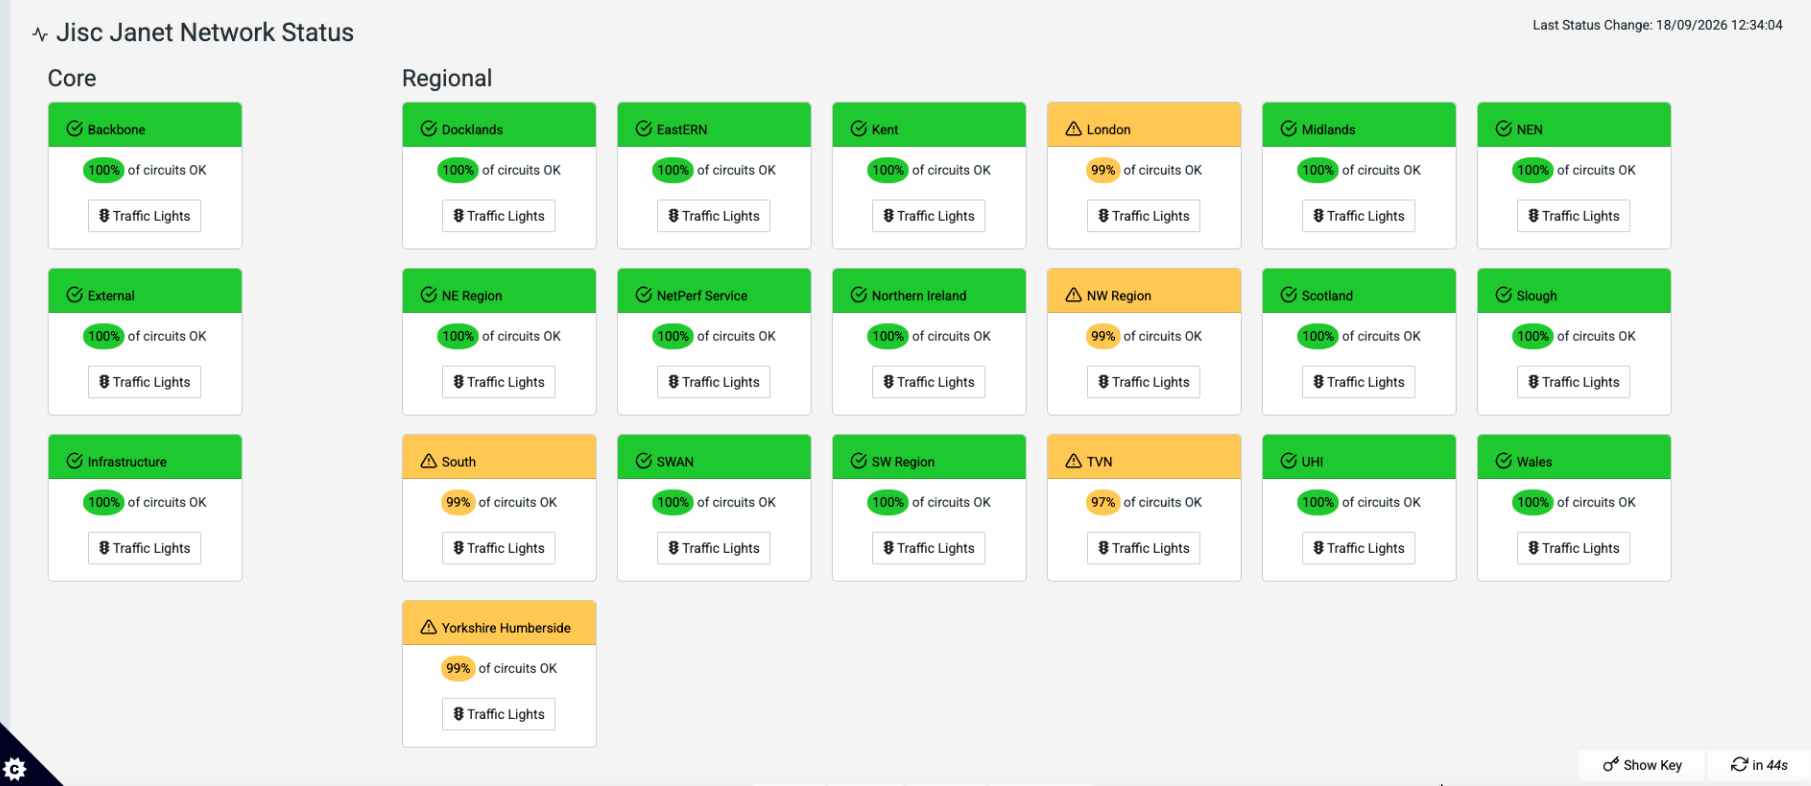
The Netsight3 home page provides a summary view of circuit statuses for the different regions of the Janet Network. The display is based on a RAG (Red, Amber, Green) rating showing the number of circuits in each region that are down, degraded and up respectively.
The home page is also the entry point for the Traffic Lights sub-system which uses RAG ratings to indicate whether circuits are down, degraded or operational.
The home page gives an overview of circuit health across each of the Janet Network regions, plus the Janet Core.
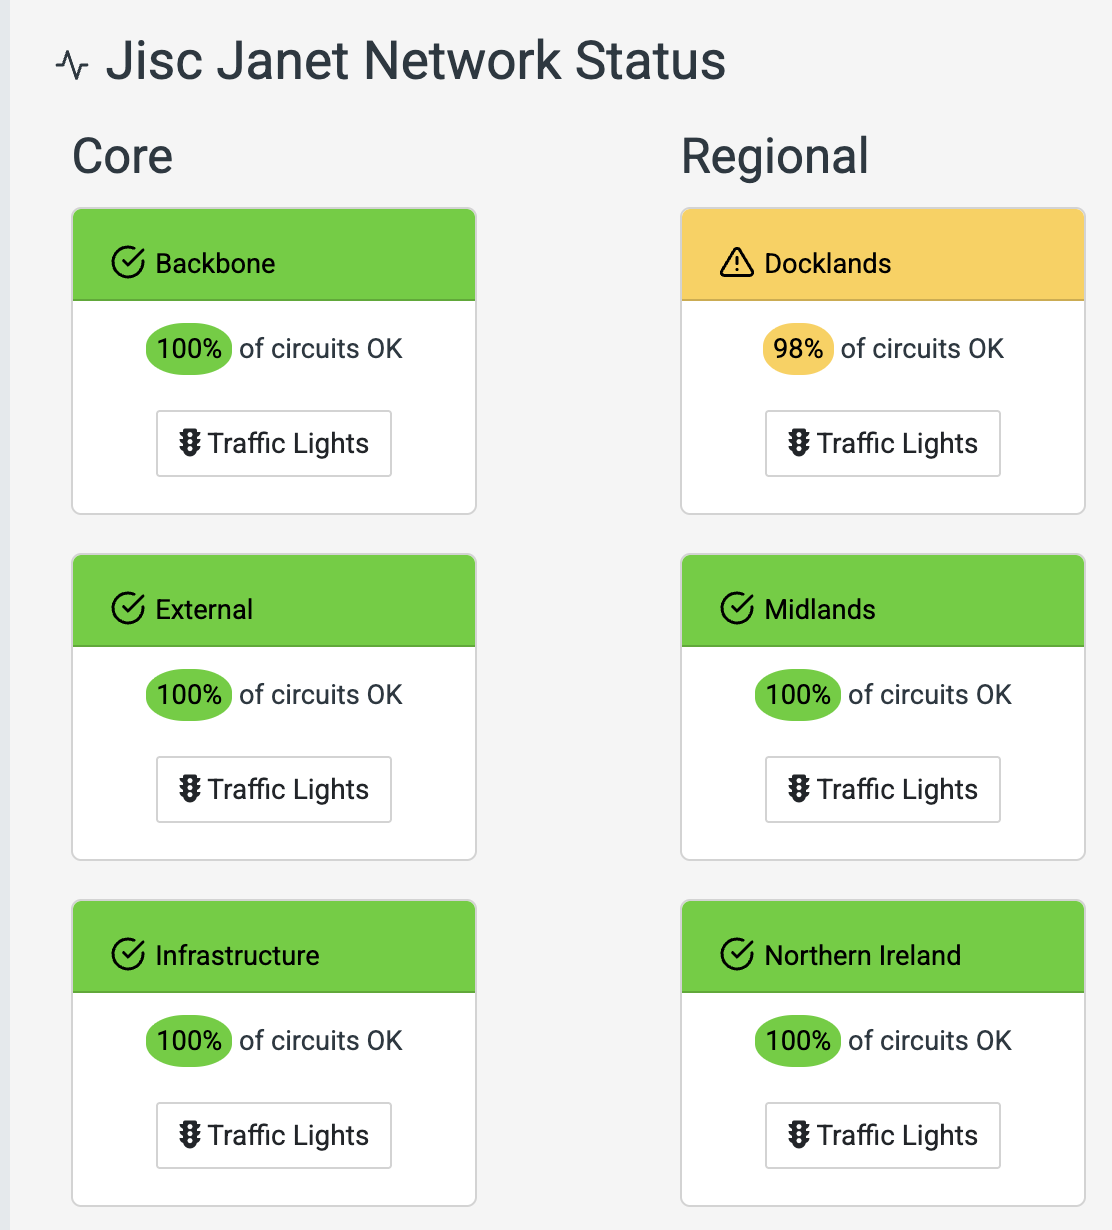
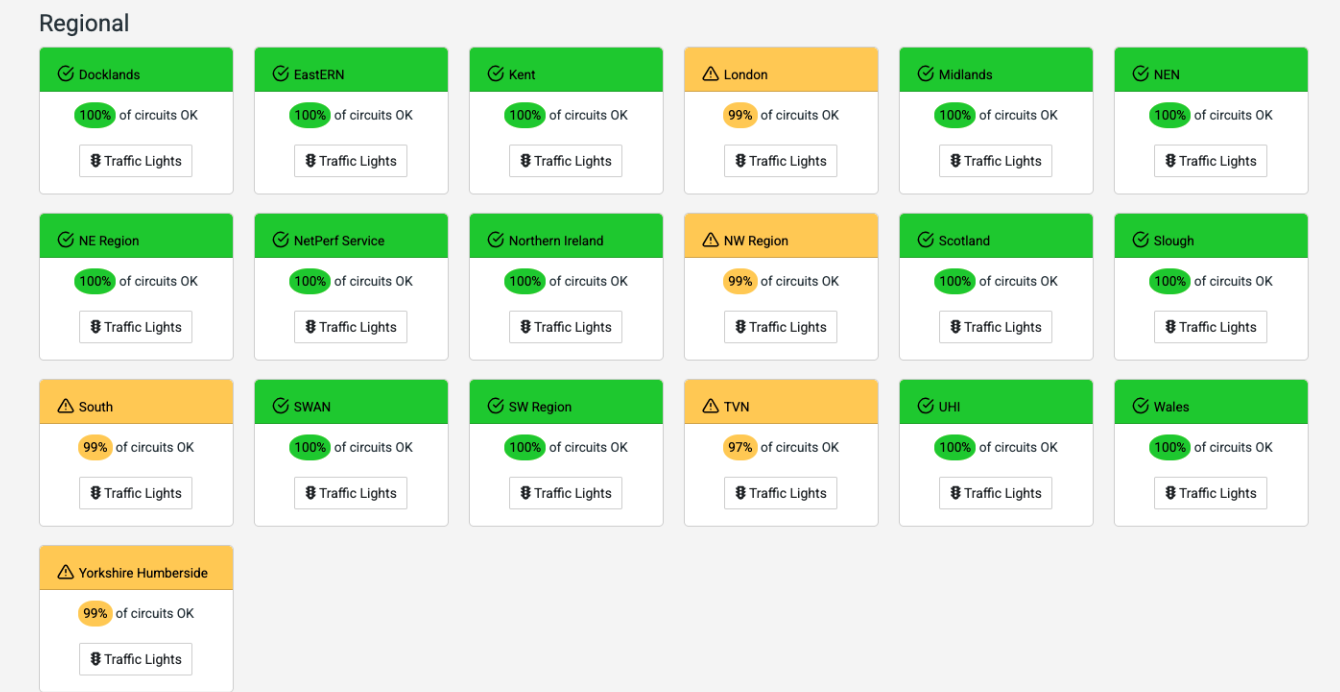
Where a region's card is marked as green, all connections in that area are up. Where a card is marked as yellow, some connections in that region are either degraded or down. Where a card is marked as orange, more than 10% of circuits in the region are down. Where a card is marked as red, that indicates more than 99% of the connections in that region are degraded or down.
The status of each connection is based on ping (ICMP Echo) percentage packet loss. A percentage packet loss greater than 40% and less than 90% would mark a circuit as degraded / yellow. A percentage packet loss of 90% or greater would mean the circuit as down. Packet loss below 40% and the circuit would be marked as up.
6.1 Status of the Janet Core
The home page display is split into two sections. On the left-hand side, there are RAG rated cards, colour coded to display the status of the sections of the Janet Core (Backbone, External connections and Infrastructure).
6.2 Status of the Janet Regional Delivery Areas
On the right-hand side, occupying most of the screen, are RAG rated cards colour coded to display the status of the different Regional Delivery Areas of the Janet Network.
These were originally separately managed networks in a consortium but were taken under full management of the Janet Network some years ago.
6.3 Refresh cycles for this page
The underlying data for both the home and Quick Status pages requires a degree of pre-processing and aggregation and is therefore performed by a process running in the background on a once per minute cycle. A timestamp for when the underlying data was last refreshed is displayed at the top right of the page.

The page itself is refreshed to pull fresh data every sixty seconds starting from when you first load the page into your browser. There is a count down timer bottom-right of the screen.
The behaviour of this page differs slightly to the Traffic Lights views. For those pages, the data is refreshed when the page is loaded into the browser and the refresh cycle is based upon the time the page was first loaded for you.
7. Traffic Lights per region
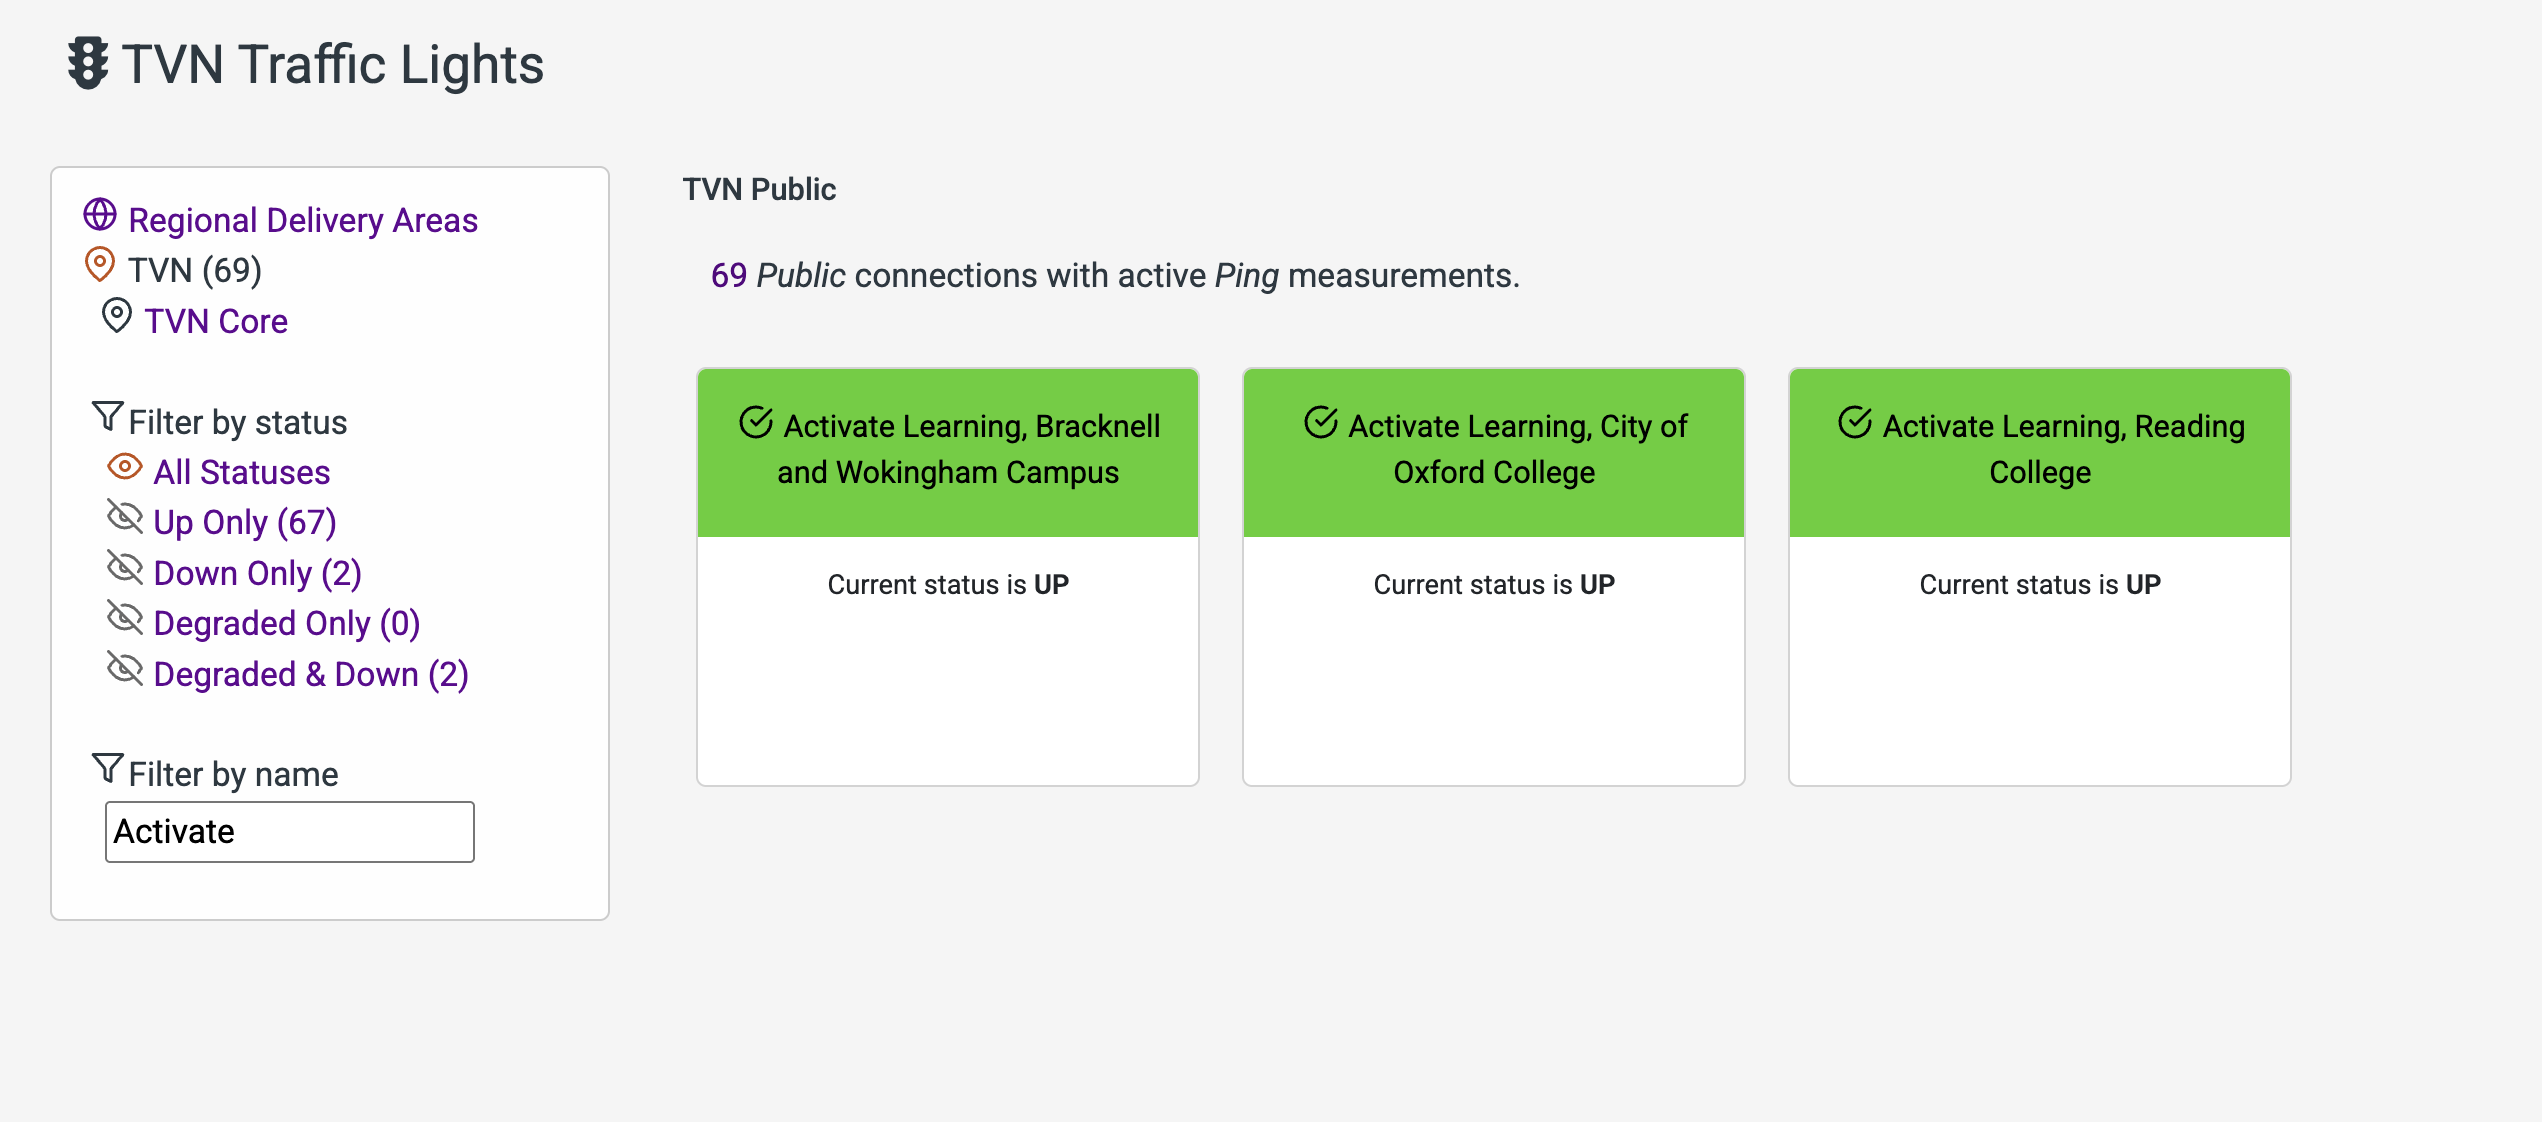
The Netsight3 Traffic Lights views provide a RAG rated display of all the circuits / connections in a specific region of the Janet Network.
Login is required in order to access the new Traffic Lights pages.
7.1 Traffic Lights RAG rating
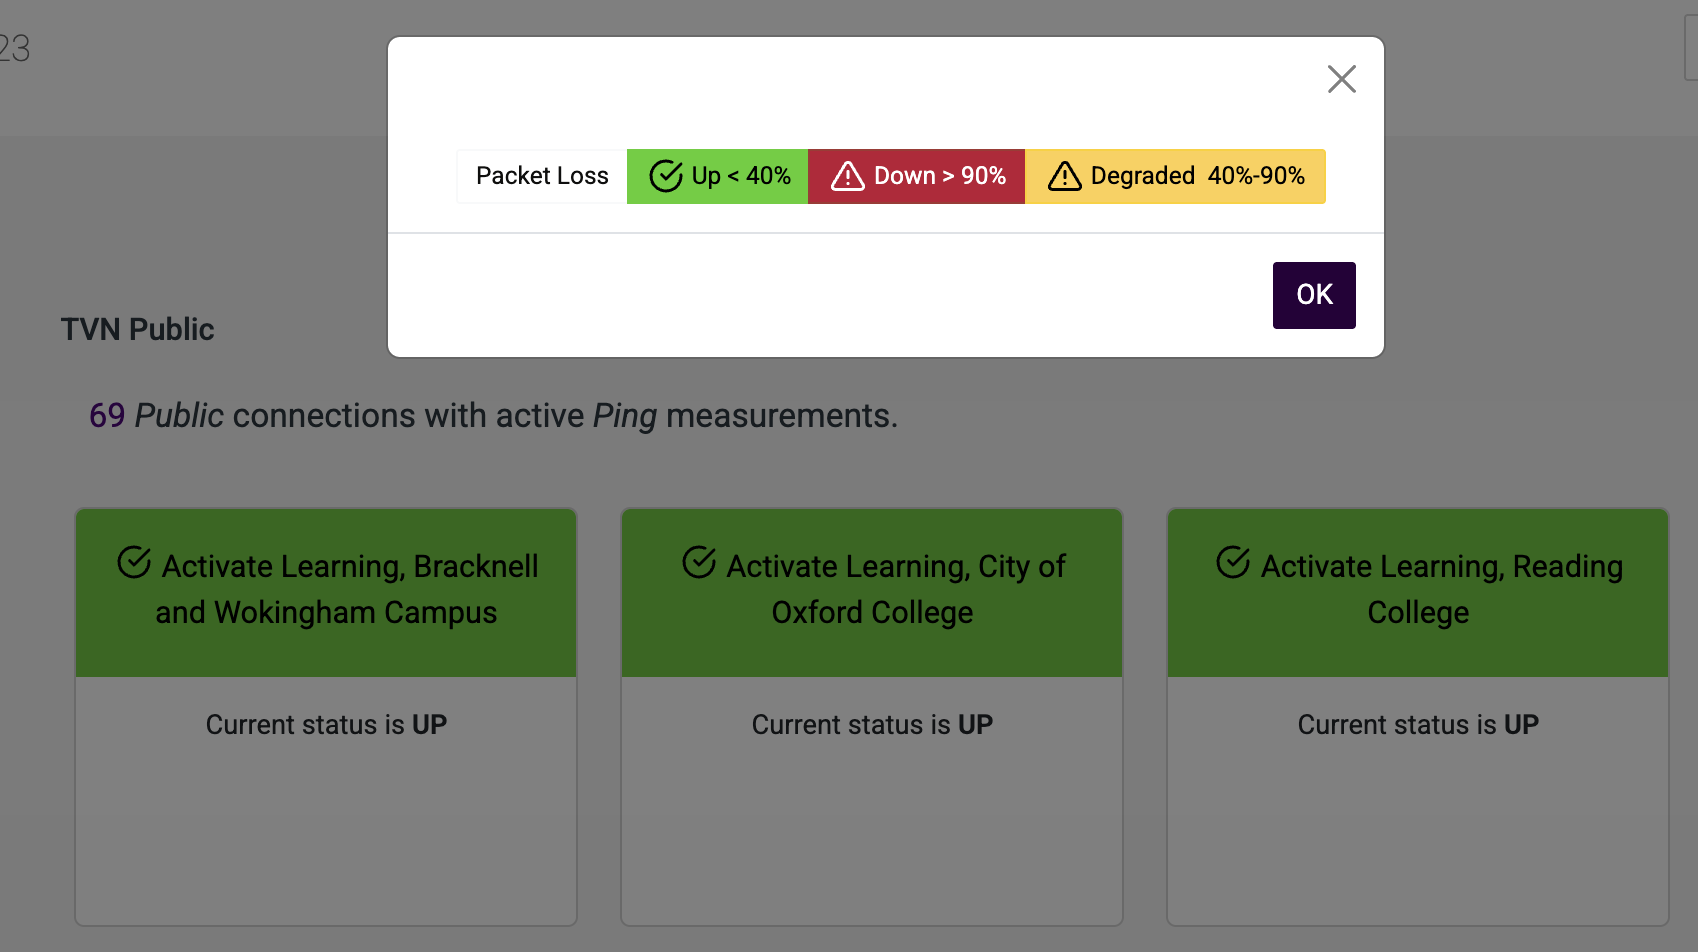
Using the same rubric as the home page and the Quick Status view, the Traffic Lights views show counts of Reporting Paths or circuits in each region. These are colour coded using a RAG rating. They mark paths as Red / Down where packet loss is greater than 90% and Amber / Degraded where packet loss is between 40% and 90%. Where packet loss is less than 40%, cards are marked as Green / Up.
Choose the Show Key button, bottom right on the page to see the key.
7.2 The filters menu
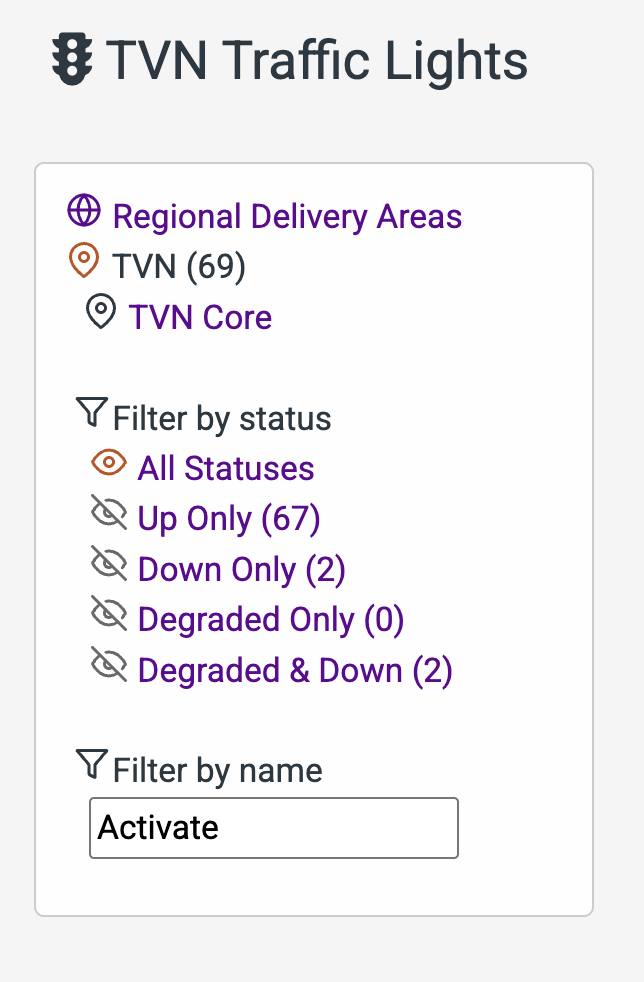
It is possible to filter the Traffic Lights views and display cards based on a particular status or circuit name using the filter functions on the left of the screen.
Note that the filter links display counts of connections with each status in brackets.
7.2.1 Filter by Status
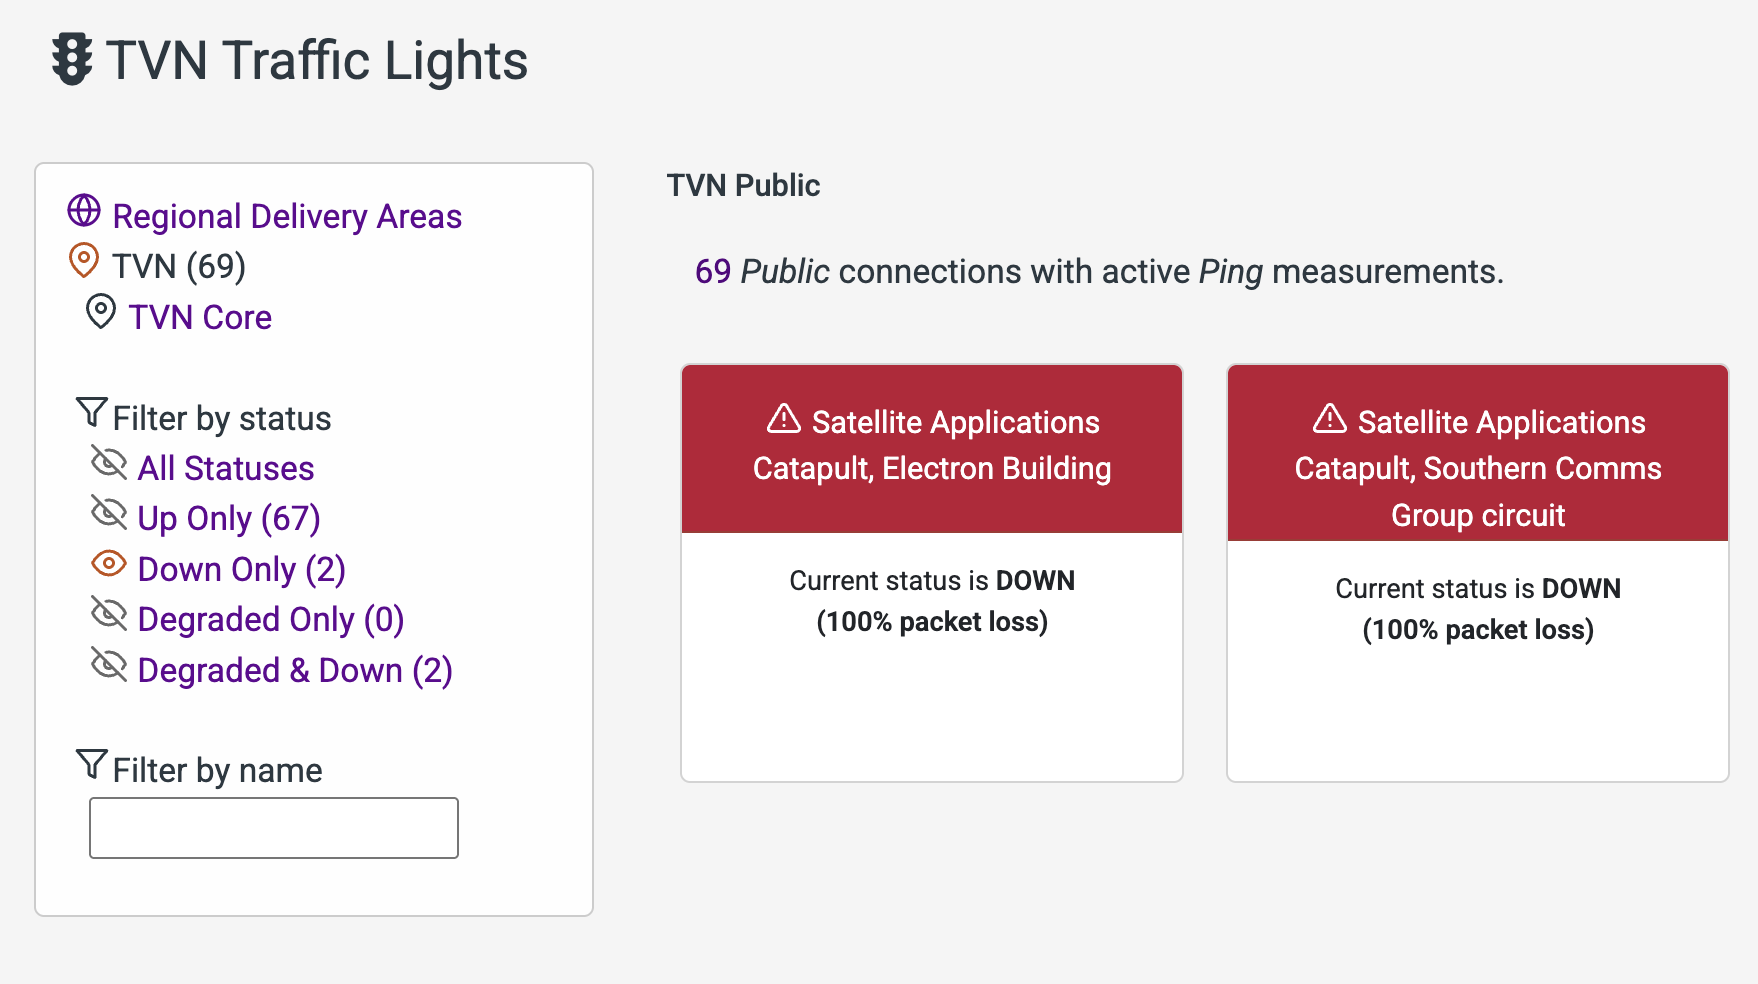
Selecting the Down Only filter will only show those cards where the status is Down for example:
7.2.2 Filter by circuit name
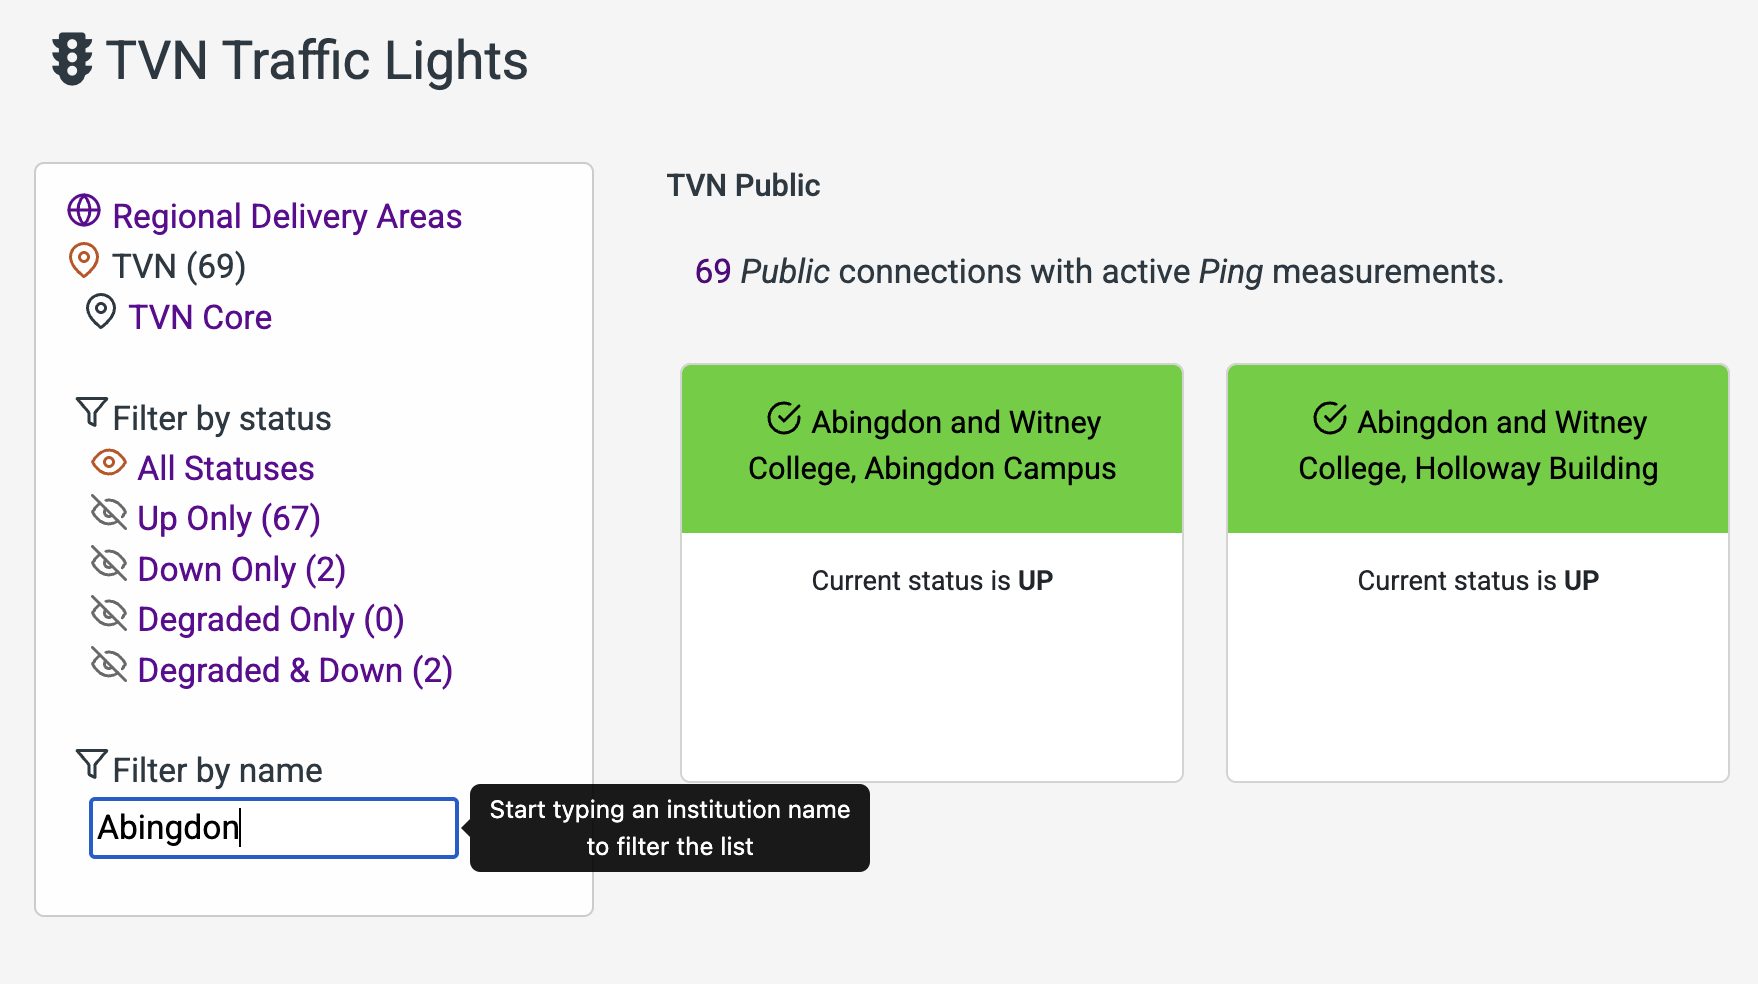
It is also possible to filter by keywords found in the name of circuits (reporting paths). Start typing in the Filter by name box and the view will be limited to circuits where the name contains that keyword.
7.3 Refresh cycle
The page is refreshed on a sixty second cycle and the next time to refresh is displayed bottom right on the page. The refresh time is based upon a start time of when the page was loaded.
8. Status With Counts
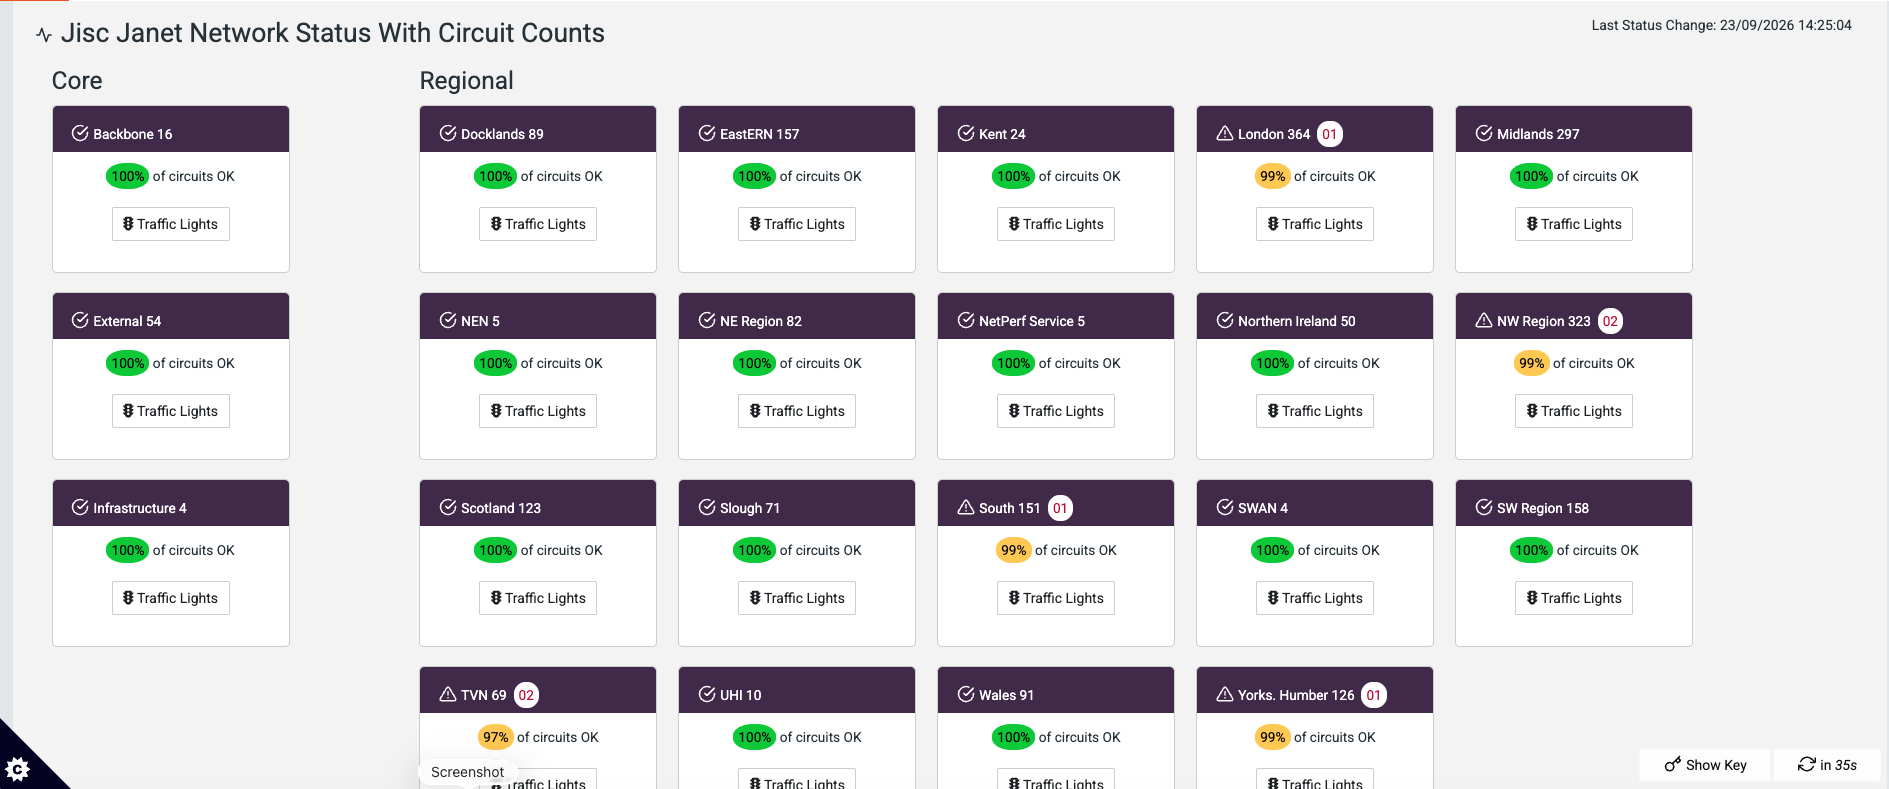
The Status With Counts view is a variant of the home page view with the addition of circuit counts information for each region.
See section 6 for more information about the Home page view.
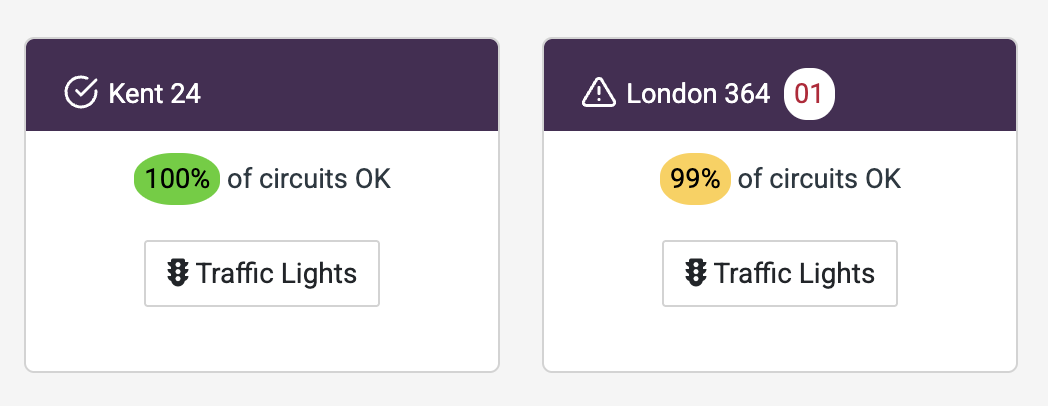
Where circuits are down, counts are shown in red text in a white circle next to the region count. Where circuits are degraded, counts are shown in black text on a yellow circle.
9. Quick Status
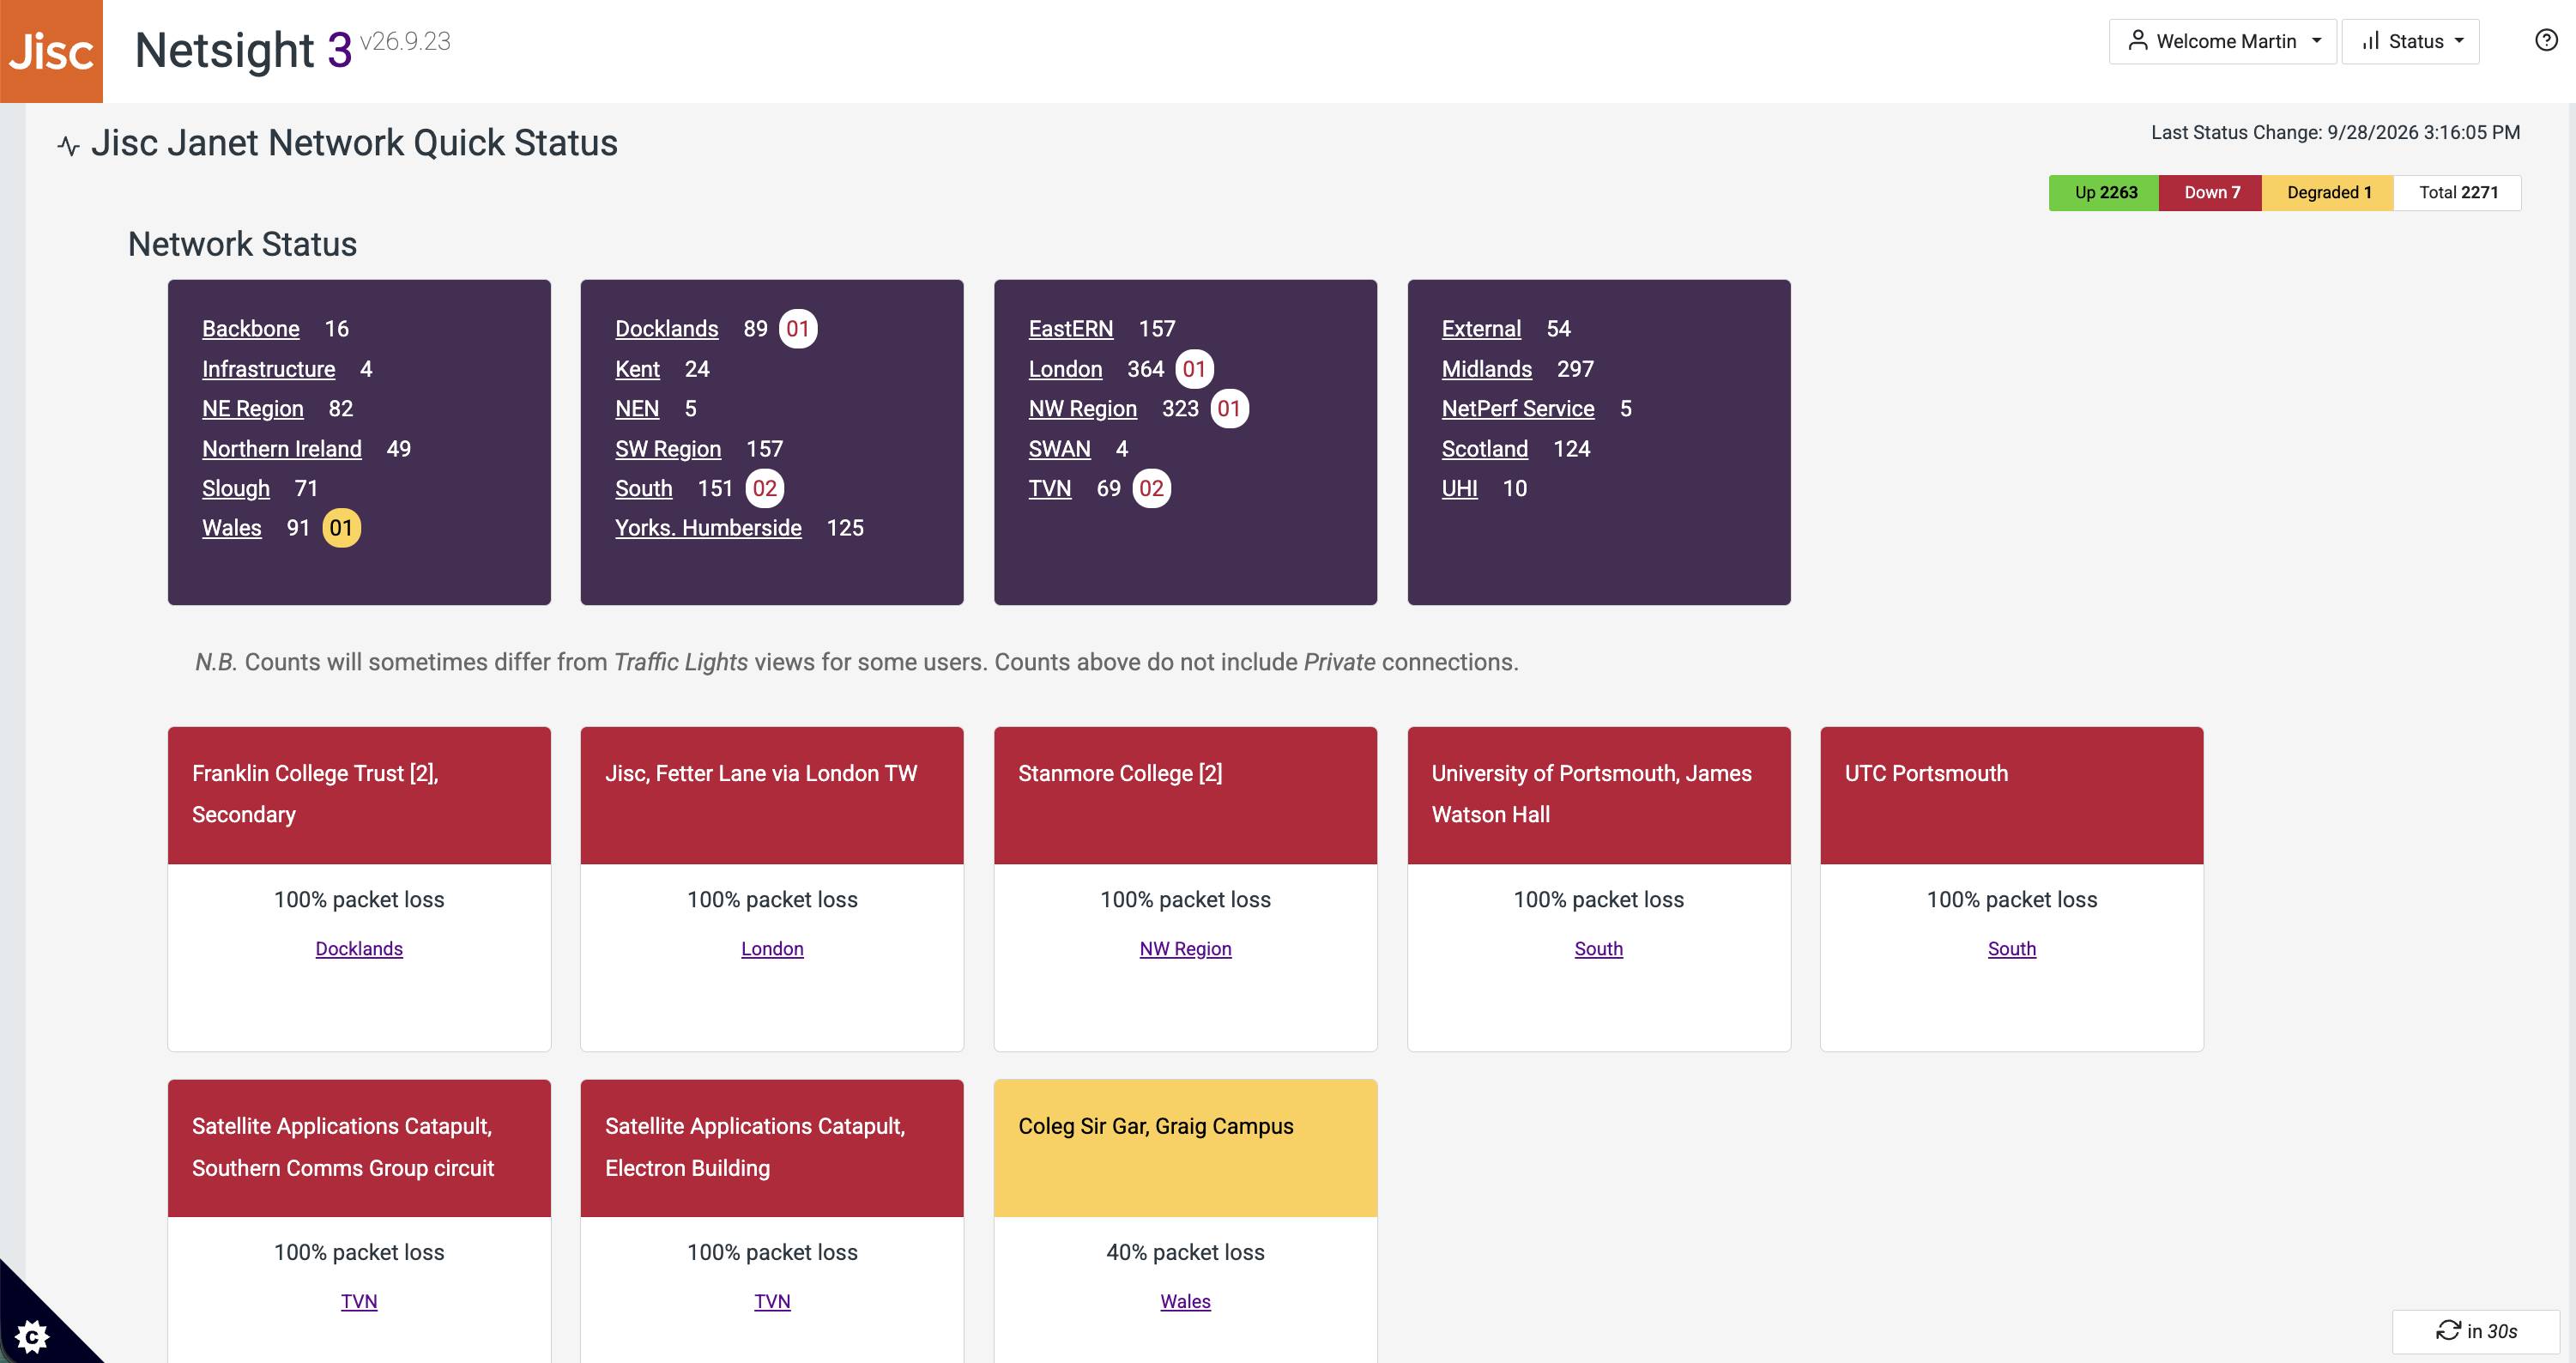
The Netsight3 Quick Status screen gives an overview of current issues on the different parts of the Janet Network.
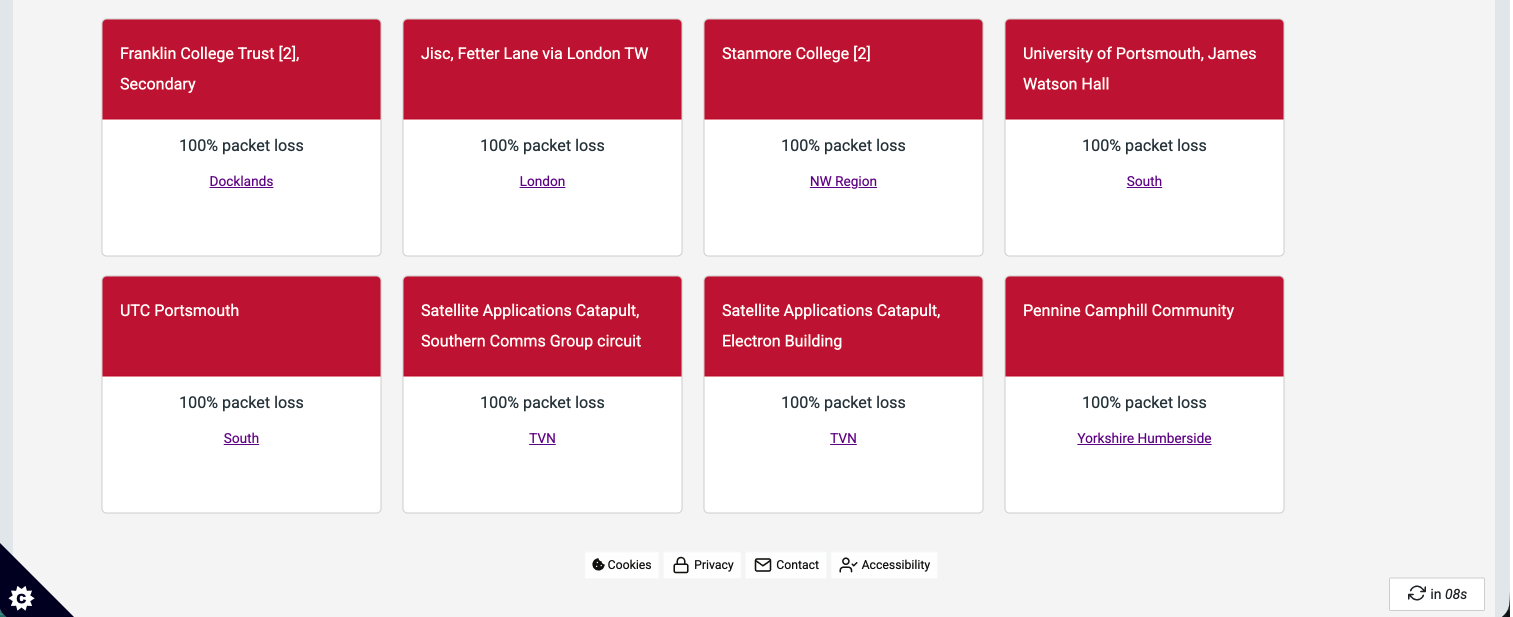
Counts of circuits in each region are provided, along with counts of circuits that are down or degraded. In addition Traffic Lights style cards are displayed for each circuit that is degraded or down.
The status of each connection is based on ping (ICMP Echo) percentage packet loss. A percentage packet loss greater than 40% and less than 90% would mark a circuit as degraded (yellow). A percentage packet loss of 90% or greater would mean the circuit is down (red).
9.1 The Network Status section
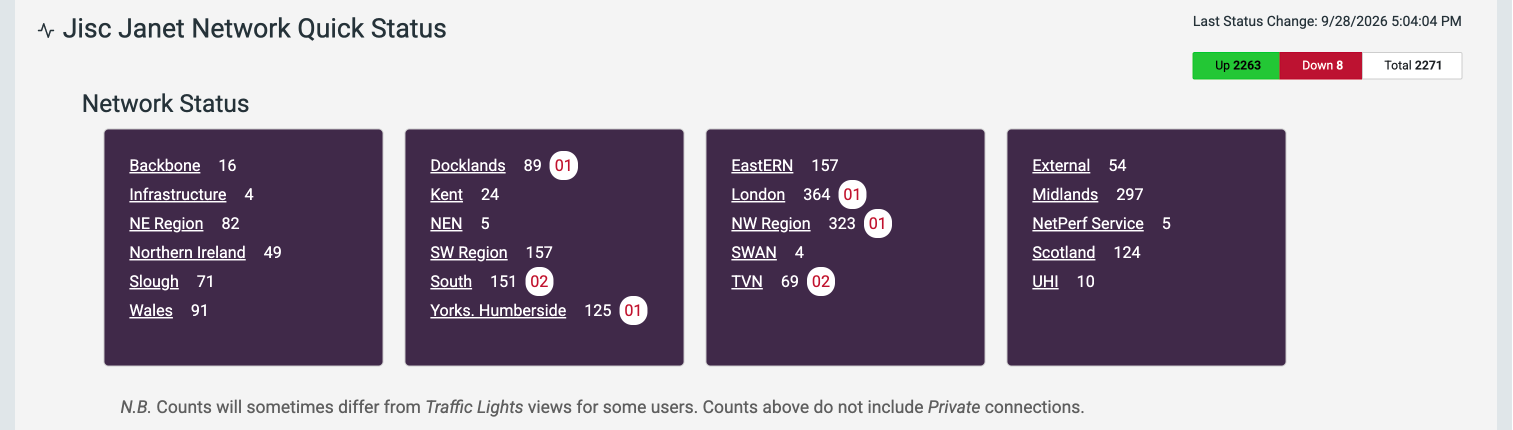
The Network Status section at the top the screen displays counts of public circuits by region. In addition, where circuits are down, counts are shown in red text in a white circle next to the region count. Where circuits are degraded, counts are shown in black text on a yellow circle.
Choosing the name of each region listed will take you through to the appropriate Traffic Lights view for that region.
9.2 The Degraded / Down Connections card list
In addition to the regional counts at the top of the page, the Quick Status page also shows Traffic Lights style RAG rated cards for all down and degraded connections.